

Question: The question is the screenshot. 9. Interpreting statistical software output for a hypothesis test about the difference between two means (paired samples) You are a
The question is the screenshot.
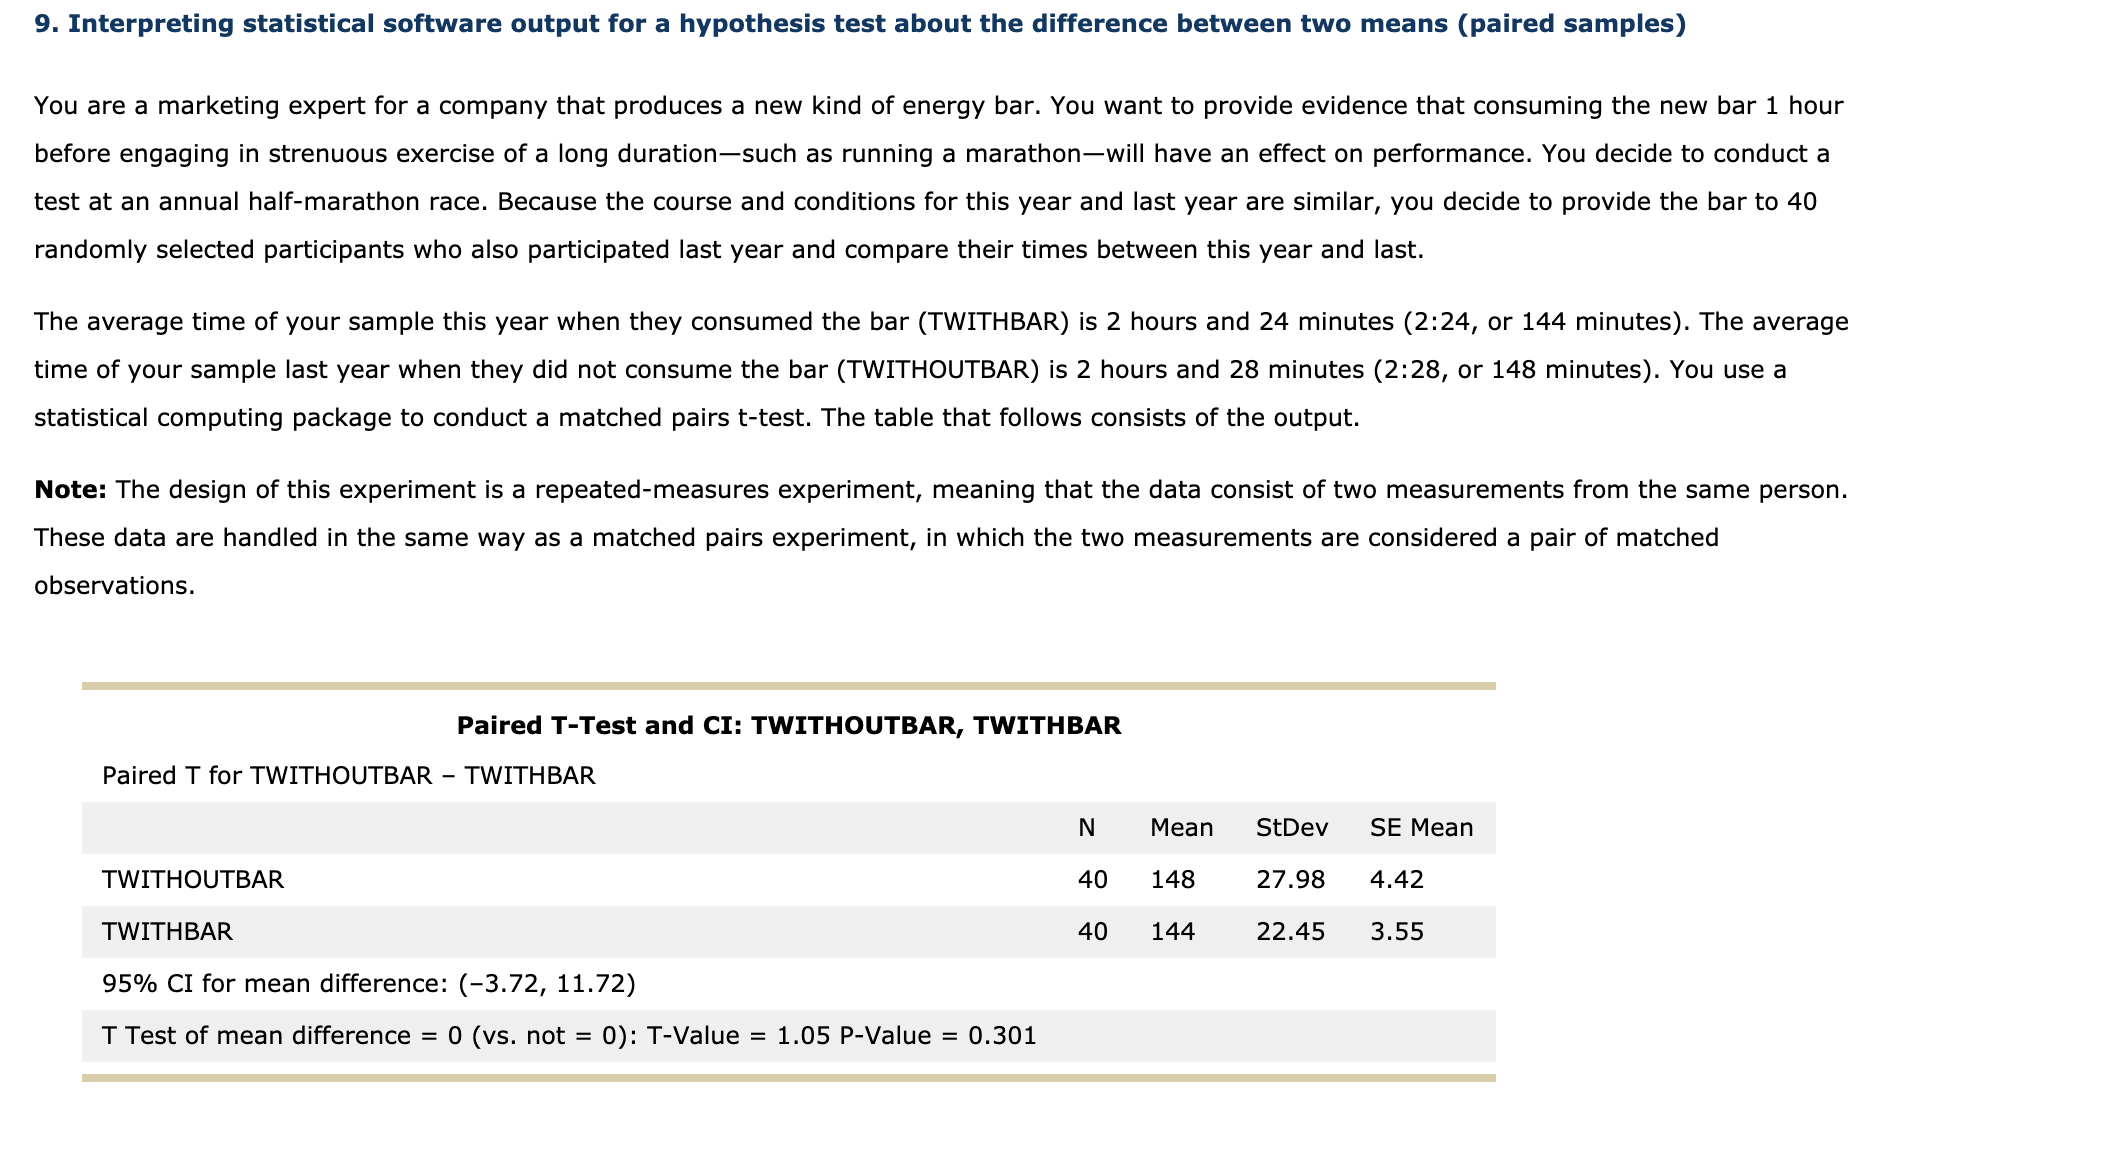
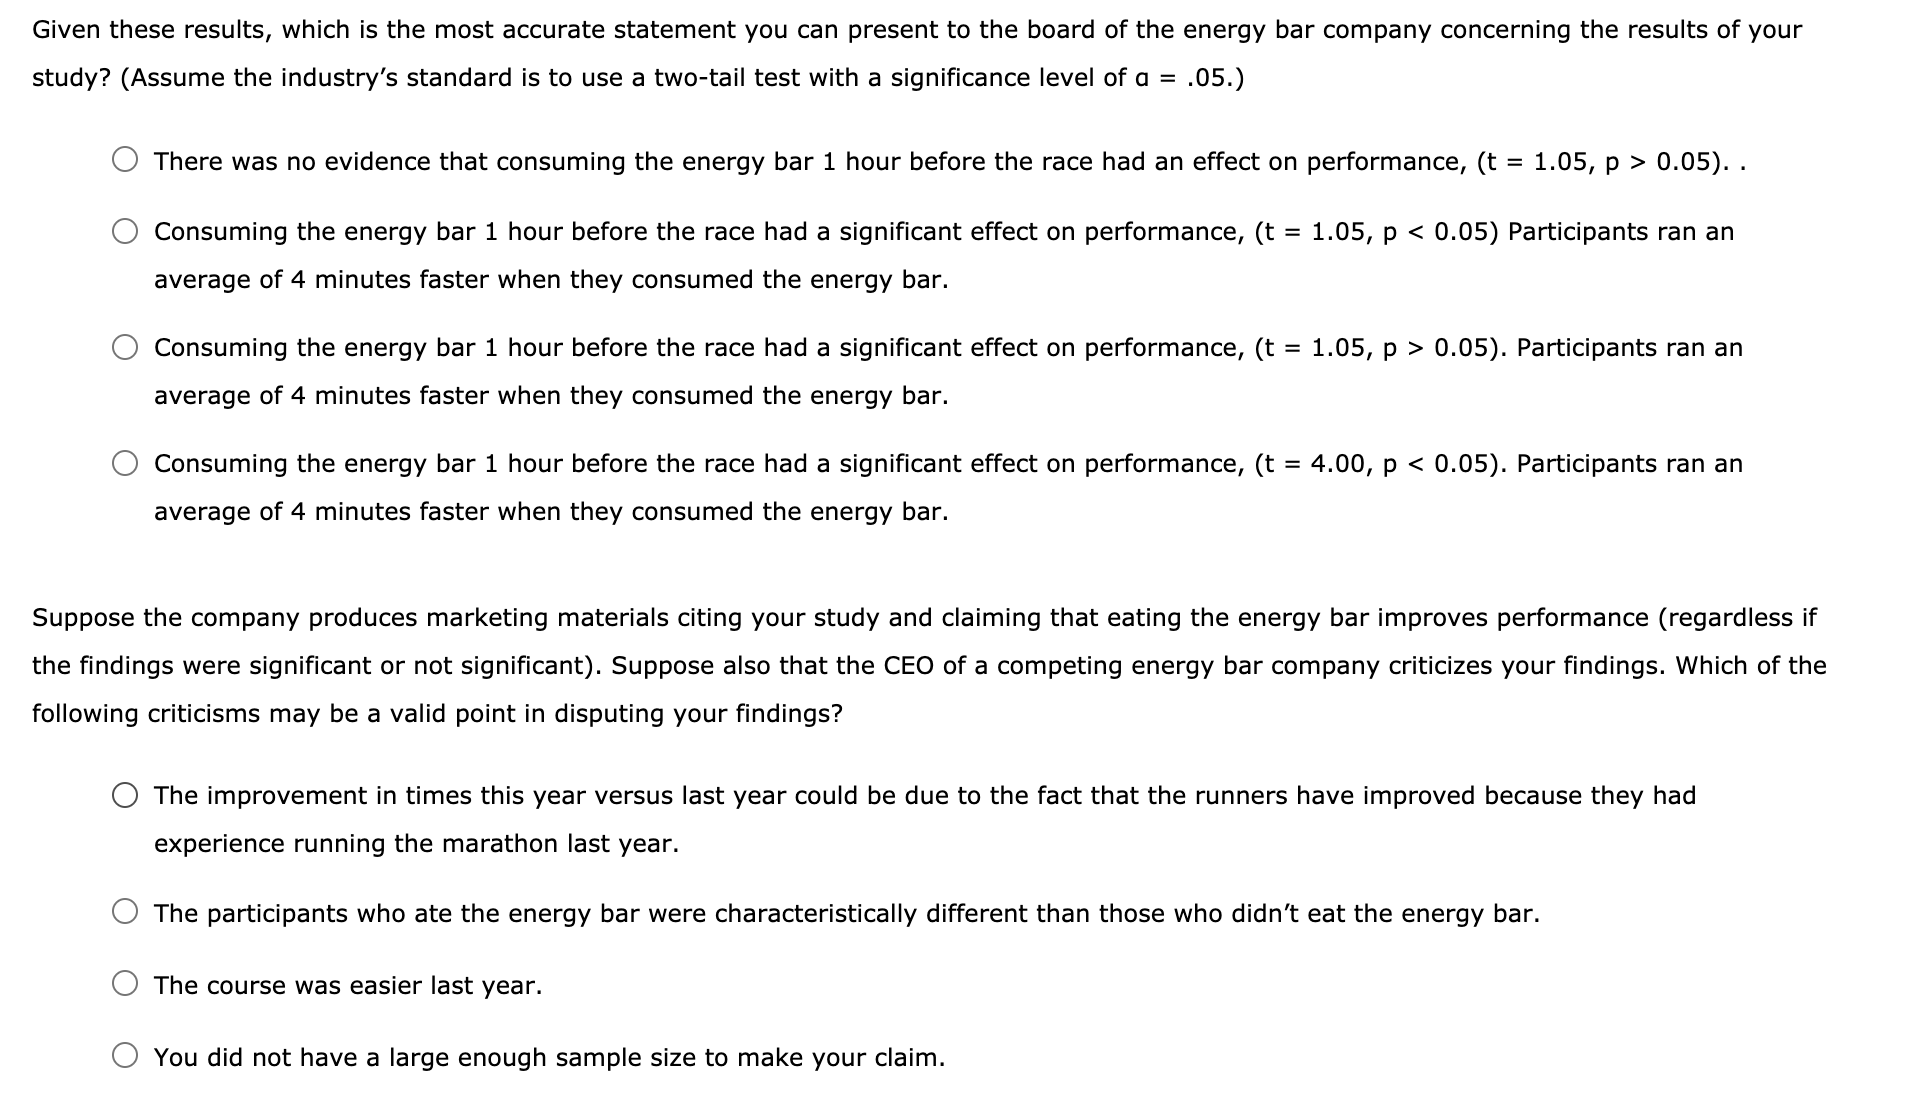
9. Interpreting statistical software output for a hypothesis test about the difference between two means (paired samples) You are a marketing expert for a company that produces a new kind of energy bar. You want to provide evidence that consuming the new bar 1 hour before engaging in strenuous exercise of a long durationsuch as running a marathonwill have an effect on performance. You decide to conduct a test at an annual half-marathon race. Because the course and conditions for this year and last year are similar, you decide to provide the bar to 40 randomly selected participants who also participated last year and compare their times between this year and last. The average time of your sample this year when they consumed the bar (TWITHBAR) is 2 hours and 24 minutes (2:24, or 144 minutes). The average time of your sample last year when they did not consume the bar (TWITHOUTBAR) is 2 hours and 28 minutes (2:28, or 148 minutes). You use a statistical computing package to conduct a matched pairs t-test. The table that follows consists of the output. Note: The design of this experiment is a repeated-measures experiment, meaning that the data consist of two measurements from the same person. These data are handled in the same way as a matched pairs experiment, in which the two measurements are considered a pair of matched observations. Paired T-Test and CI: TWITHOUTBAR, TWITHBAR Paired T for TWITHOUTBAR TWITHBAR N Mean StDev SE Mean TWITHOUTBAR 40 148 27.98 4.42 TWITHBAR 40 144 22.45 3.55 95% CI for mean difference: (3.72, 11.72) T Test of mean difference = 0 (vs. not = 0): T-Value = 1.05 P-Value = 0.301 Given these results, which is the most accurate statement you can present to the board of the energy bar company concerning the results of your study? (Assume the industry's standard is to use a two-tail test with a significance level of o = .05.) 0 There was no evidence that consuming the energy bar 1 hour before the race had an effect on performance, (t = 1.05, p > 0.05). . O Consuming the energy bar 1 hour before the race had a signicant effect on performance, (t = 1.05, p 0.05). Participants ran an average of 4 minutes faster when they consumed the energy bar. 0 Consuming the energy bar 1 hour before the race had a signicant effect on performance, (t = 4.00, p
Step by Step Solution
There are 3 Steps involved in it

Get step-by-step solutions from verified subject matter experts