

Question: the question Jack is getting frustrated by how long it takes to get served at the cafeteria. He observes that it takes longer to be
the question
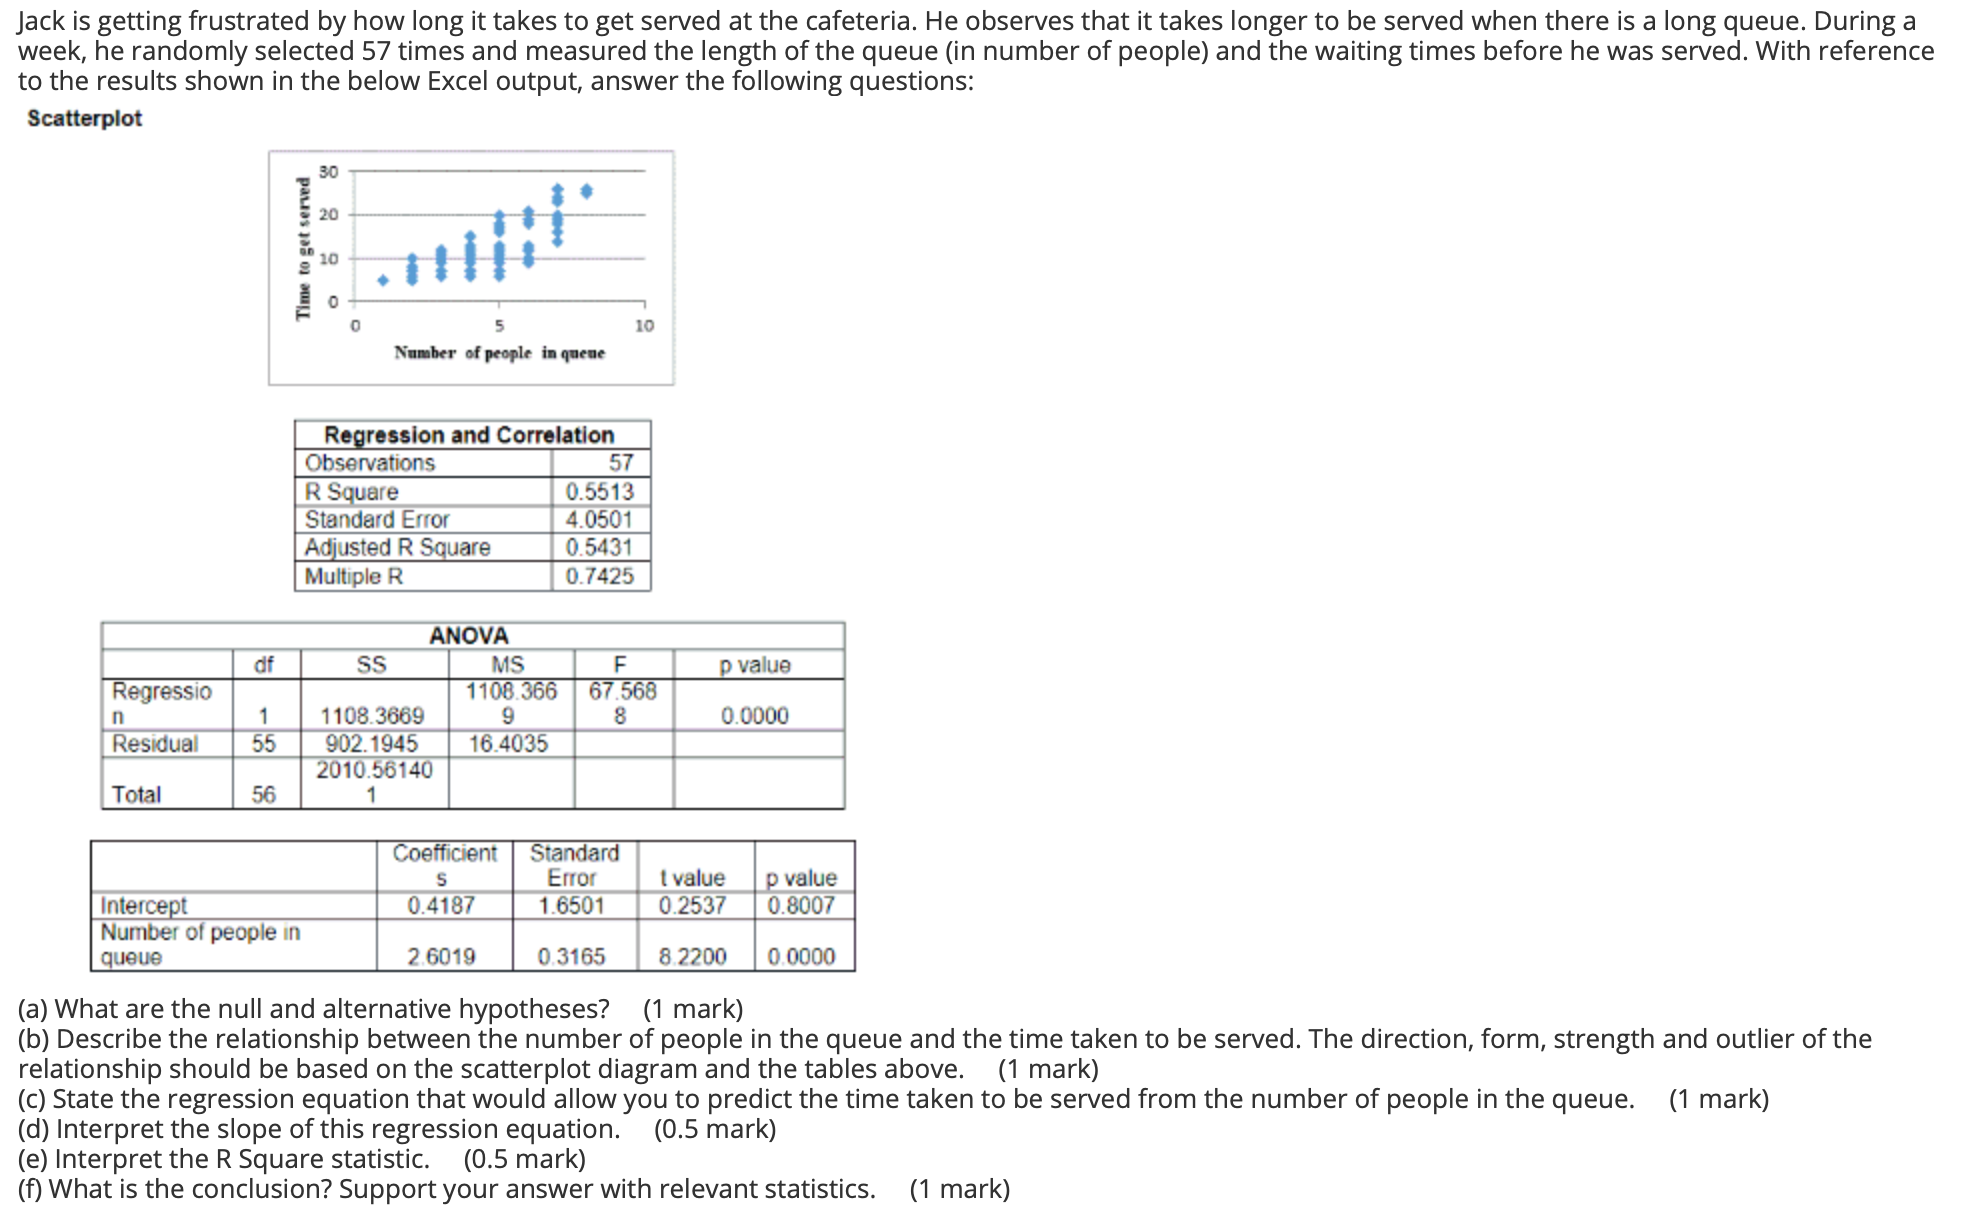
Jack is getting frustrated by how long it takes to get served at the cafeteria. He observes that it takes longer to be served when there is a long queue. During a week, he randomly selected 57 times and measured the length of the queue (in number of people) and the waiting times before he was served. With reference to the results shown in the below Excel output, answer the following questions: acne-rpm EE-El E'smm _ mm_m_-- l-EI 902.1945 16.4035 _ "a-- Intercept 0.4181 1.6501 0.2537 0.0007 Number 01 people in -uoue 26019 03165 82200 00000 (a) What are the null and alternative hypotheses? ('I mark) (h) Describe the relationship between the number of people in the queue and the time taken to be served. The direction, form, strength and outlier of the relationship should be based on the scatterplot diagram and the tables above. (1 mark) (c) State the regression equation that would allow you to predict the time taken to be sen/ed from the number of people in the queue. (1 mark) (d) Interpret the slope of this regression equation. (0.5 mark) (e) Interpret the R Square statistic. (0.5 mark) (f) What is the conclusion? Support your answer with relevant statistics. ('I mark)
Step by Step Solution
There are 3 Steps involved in it

Get step-by-step solutions from verified subject matter experts