

Question: The question or task to be completes is, Use time-series decomposition and the regression program included in the Excel Data Analysis ToolPak to find the
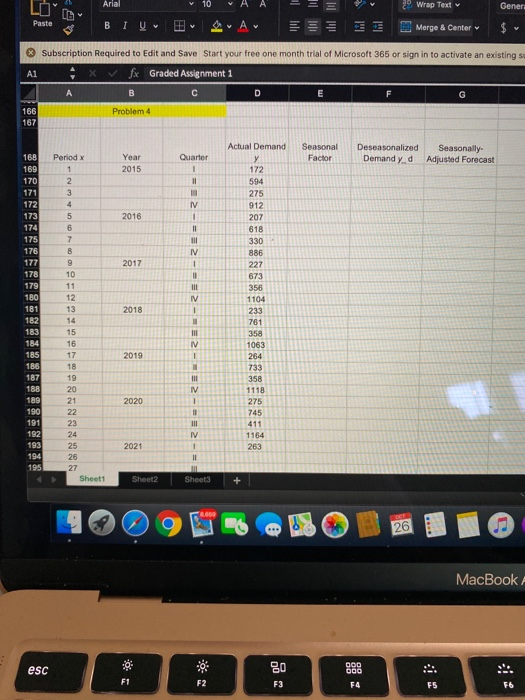
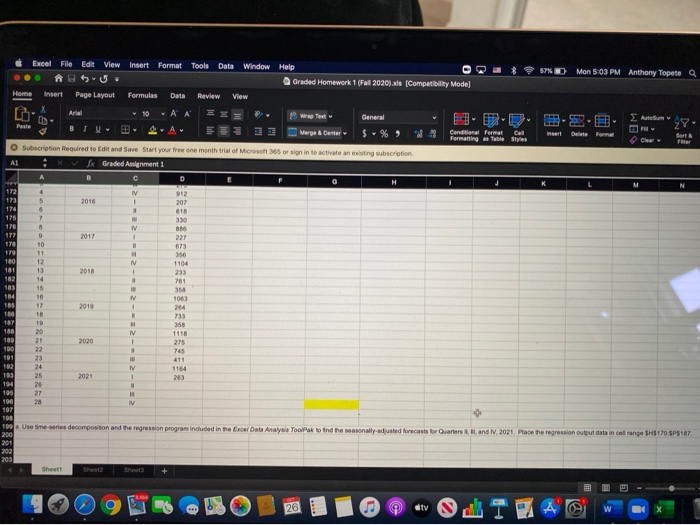
The question or task to be completes is, Use time-series decomposition and the regression program included in the Excel Data Analysis ToolPak to find the seasoanlly-adjusted forecast for Quarters II, III, and IV, 2021. Place the regression output data in cell range $H$170:$P$187.
Arial A A Wrap Text Geners Paste B TV Lul Merge & Center X Al Subscription Required to edit and Save Start your free one month trial of Microsoft 365 or sign in to activate an existing su Xfx Graded Assignment 1 A B D E F G Problem 4 166 167 Seasonal Factor Year 2015 Deseasonalized Demand yd Quarter 1 Seasonally Adjusted Forecast 168 169 170 171 172 173 174 175 176 177 178 Periodx 1 2. 3 4 5 6 7 8 9 2016 Actual Demand y 172 594 275 912 207 618 330 886 227 673 356 1104 2017 179 2018 233 180 181 182 183 184 185 186 187 188 189 190 191 192 193 2019 10 11 12 13 14 15 16 17 18 19 20 21 22 23 24 25 26 27 Sheet1 --- ZE-ZEE- ZEE- ZE= -2= 761 358 1063 264 733 358 1118 275 745 411 1164 263 2020 2021 194 195 Sheet2 Sheet3 + 8650 26 MacBook esc DOO nnn JU 80 F3 F1 F2 F4 F5 F6 Excel File Edit View Insert Format U. Mon 5:03 PM Anthony Topete Q Tools Data Window Help Graded Homework 1 (Fall 2020).xls (Compatibility Model Review View Home Insert Page Layout Formules Data EE A A General Peste Merge & Center $ - % ) 23 Conditional Format Cell Insert Delete Form Fermatting Table Styles ww Sert & Subscription Required to edit and Save Start your free one month trial of Microsoft or sign in to activate an existing subscription A1 Graded Assignment i B C my N 172) 4 IV 912 173 5 2018 1 207 174 1 618 175 7 330 178 M B 177 2017 1 227 178 10 673 179 11 11 350 180 12 IV 1104 180 13 2018 ! 235 182 14 1 761 183 15 354 14 10 M 1063 15 17 2010 1 24 100 10 733 187 19 358 180 20 IV 1118 189) 21 2020 275 190 22 . 745 191 23 411 182 24 M 1164 100 25 2021 1 263 194 195 27 196 28 IV 197 190 100 Use time-wries decomposition and the regression programs included in the Excel Data Analysis ToolPak to find the seasonally adjusted forecast for Quarters, and IV 2021. Place the regression output data in cel range $3170 5P5187 200 201 202 2031 Sheet Sheet2 Sheet i 26 tv A W 197 198 199 a. Use time-series decomposition and the regression program included in the Excel Data Analysis ToolPak to find the season 200 201 202 nd the seasonally-adjusted forecasts for Quarters II, III and IV, 2021. Place the regression output data in cell range $H$170:$P$187
Step by Step Solution
There are 3 Steps involved in it
1 Expert Approved Answer
Step: 1 Unlock

Question Has Been Solved by an Expert!
Get step-by-step solutions from verified subject matter experts
Step: 2 Unlock
Step: 3 Unlock