

Question: this is the question at the bottom. a. use time-series decomposition and the regression program included in the excel data analysis toolpak to find the
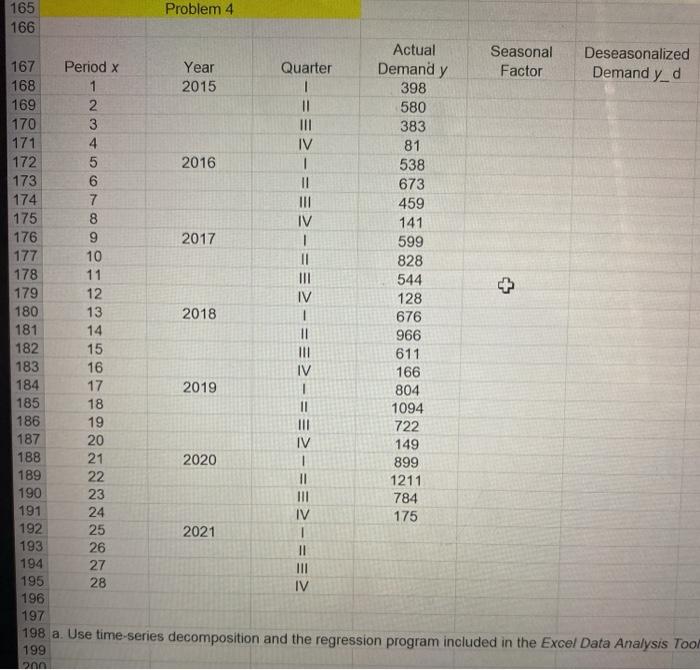
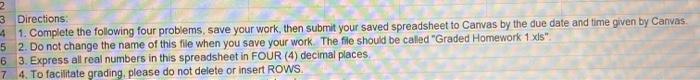
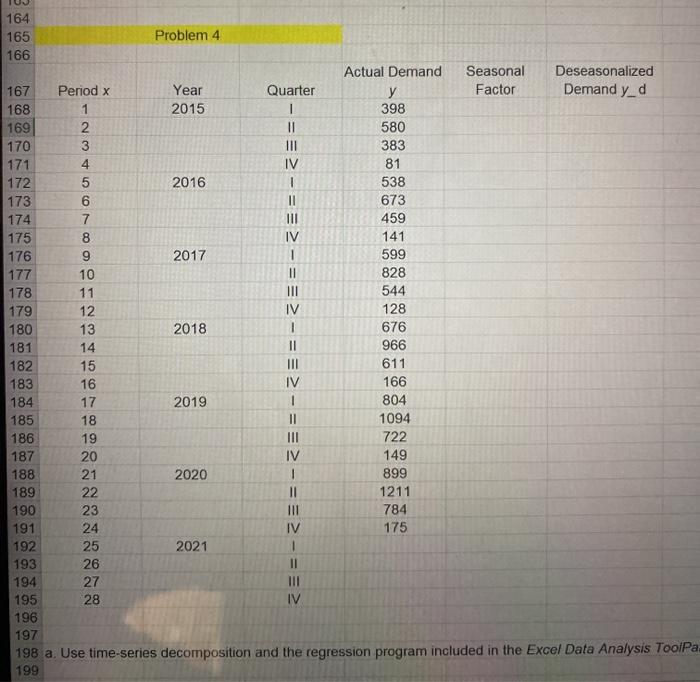
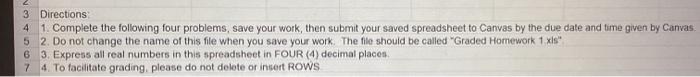
%3D-%3D + 165 Problem 4 166 Actual Seasonal Deseasonalized 167 Period x Year Quarter Demand y Factor Demand y_d 168 1 2015 1 398 169 2 580 170 3 383 171 4 IV 81 172 5 2016 538 173 673 174 7 459 175 8 IV 141 176 9 2017 599 177 10 828 178 11 544 179 12 IV 128 180 13 2018 676 14 II 966 182 15 III 183 16 IV 166 184 17 2019 | 804 185 18 II 1094 186 19 722 187 20 IV 149 188 21 2020 899 189 22 1211 190 23 III 784 191 24 IV 175 192 25 2021 193 26 194 27 III 195 28 IV 196 197 198 a. Use time-series decomposition and the regression program included in the Excel Data Analysis Too 199 181 611 ==-==-= = 200 196 197 198 a. Use time-series decomposition and the regression program included in the Excel Data Analysis ToolPak to f 199 200 rogram included in the Excel Data Analysis ToolPak to find the seasonally adjusted forecasts for Quarters, and IV 2021 2 3 Directions: 4 1. Complete the following four problems, save your work, then submit your saved spreadsheet to Canvas by the due date and time given by Canvas. 52. Do not change the name of this file when you save your work. The file should be called "Graded Homework 1 xls" 63. Express all real numbers in this spreadsheet in FOUR (4) decimal places 7 4. To facilitate grading, please do not delete or insert ROWS. => - ==>- ==> 164 165 Problem 4 166 Actual Demand Seasonal Deseasonalized 167 Period x Year Quarter y Factor Demand y_d 168 1 2015 398 169 2 11 580 170 3 383 171 4 IV 81 172 5 2016 538 173 6 II 673 174 7 459 175 8 IV 141 176 9 2017 1 599 177 10 828 178 11 544 179 12 IV 128 180 13 2018 1 676 181 14 11 966 182 15 611 183 16 IV 166 184 17 2019 1 804 185 18 1094 186 19 III 722 187 20 IV 149 188 21 2020 899 189 II 1211 190 23 III 784 191 IV 192 25 2021 193 26 II 194 27 III 195 28 IV 196 197 198 a. Use time-series decomposition and the regression program included in the Excel Data Analysis ToolPa. 199 22 .-==-= 24 175 3 Directions 4 1. Complete the following four problems, save your work, then submit your saved spreadsheet to Canvas by the due date and time given by Canvas 5 2. Do not change the name of this file when you save your work. The file should be called "Graded Homework 1.xls 6 3. Express all real numbers in this spreadsheet in FOUR (4) decimal places 7 4. To facilitate grading, please do not delete or insert ROWS %3D-%3D + 165 Problem 4 166 Actual Seasonal Deseasonalized 167 Period x Year Quarter Demand y Factor Demand y_d 168 1 2015 1 398 169 2 580 170 3 383 171 4 IV 81 172 5 2016 538 173 673 174 7 459 175 8 IV 141 176 9 2017 599 177 10 828 178 11 544 179 12 IV 128 180 13 2018 676 14 II 966 182 15 III 183 16 IV 166 184 17 2019 | 804 185 18 II 1094 186 19 722 187 20 IV 149 188 21 2020 899 189 22 1211 190 23 III 784 191 24 IV 175 192 25 2021 193 26 194 27 III 195 28 IV 196 197 198 a. Use time-series decomposition and the regression program included in the Excel Data Analysis Too 199 181 611 ==-==-= = 200 196 197 198 a. Use time-series decomposition and the regression program included in the Excel Data Analysis ToolPak to f 199 200 rogram included in the Excel Data Analysis ToolPak to find the seasonally adjusted forecasts for Quarters, and IV 2021 2 3 Directions: 4 1. Complete the following four problems, save your work, then submit your saved spreadsheet to Canvas by the due date and time given by Canvas. 52. Do not change the name of this file when you save your work. The file should be called "Graded Homework 1 xls" 63. Express all real numbers in this spreadsheet in FOUR (4) decimal places 7 4. To facilitate grading, please do not delete or insert ROWS. => - ==>- ==> 164 165 Problem 4 166 Actual Demand Seasonal Deseasonalized 167 Period x Year Quarter y Factor Demand y_d 168 1 2015 398 169 2 11 580 170 3 383 171 4 IV 81 172 5 2016 538 173 6 II 673 174 7 459 175 8 IV 141 176 9 2017 1 599 177 10 828 178 11 544 179 12 IV 128 180 13 2018 1 676 181 14 11 966 182 15 611 183 16 IV 166 184 17 2019 1 804 185 18 1094 186 19 III 722 187 20 IV 149 188 21 2020 899 189 II 1211 190 23 III 784 191 IV 192 25 2021 193 26 II 194 27 III 195 28 IV 196 197 198 a. Use time-series decomposition and the regression program included in the Excel Data Analysis ToolPa. 199 22 .-==-= 24 175 3 Directions 4 1. Complete the following four problems, save your work, then submit your saved spreadsheet to Canvas by the due date and time given by Canvas 5 2. Do not change the name of this file when you save your work. The file should be called "Graded Homework 1.xls 6 3. Express all real numbers in this spreadsheet in FOUR (4) decimal places 7 4. To facilitate grading, please do not delete or insert ROWS
Step by Step Solution
There are 3 Steps involved in it

Get step-by-step solutions from verified subject matter experts