

Question: THE QUESTION WILL BE ON FILE PLEASE In the previous table, fill in the Average Product column. Then, on the previous minimum he blue points

THE QUESTION WILL BE ON FILE PLEASE
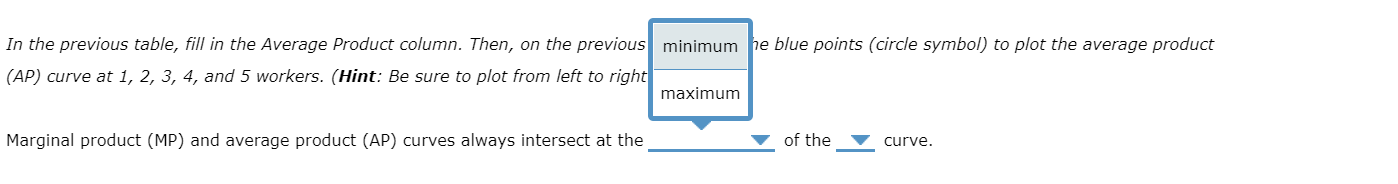
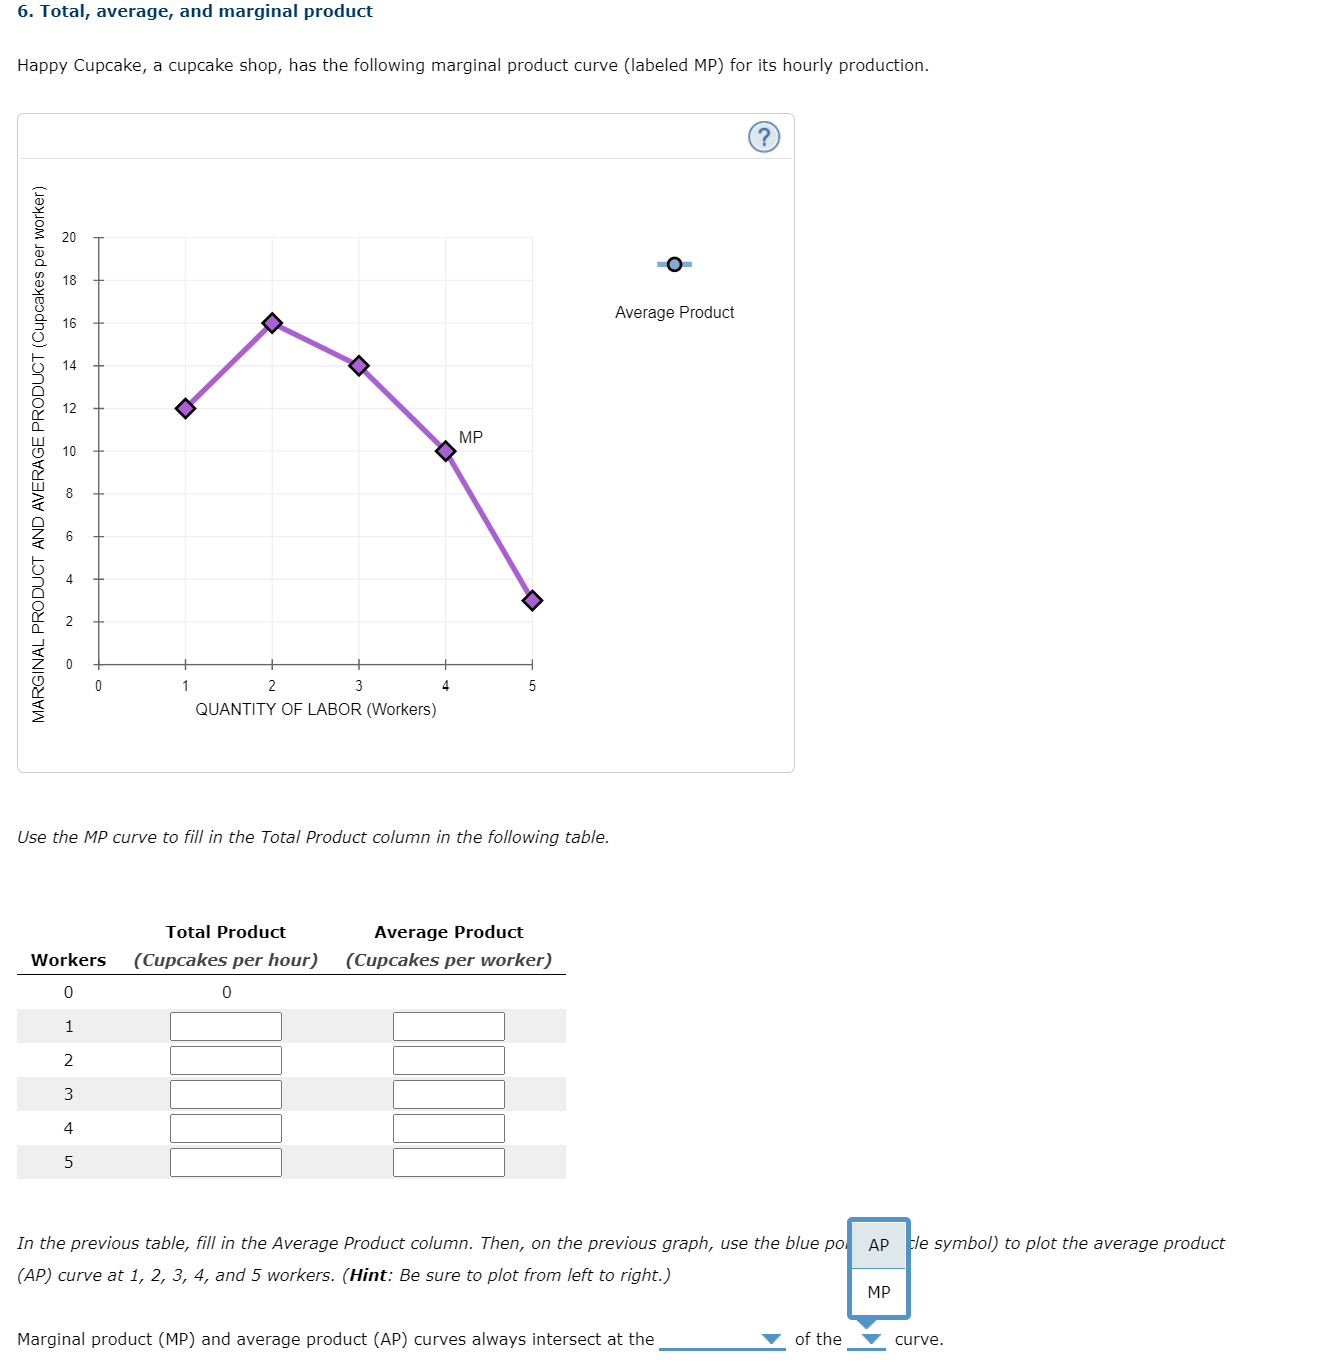
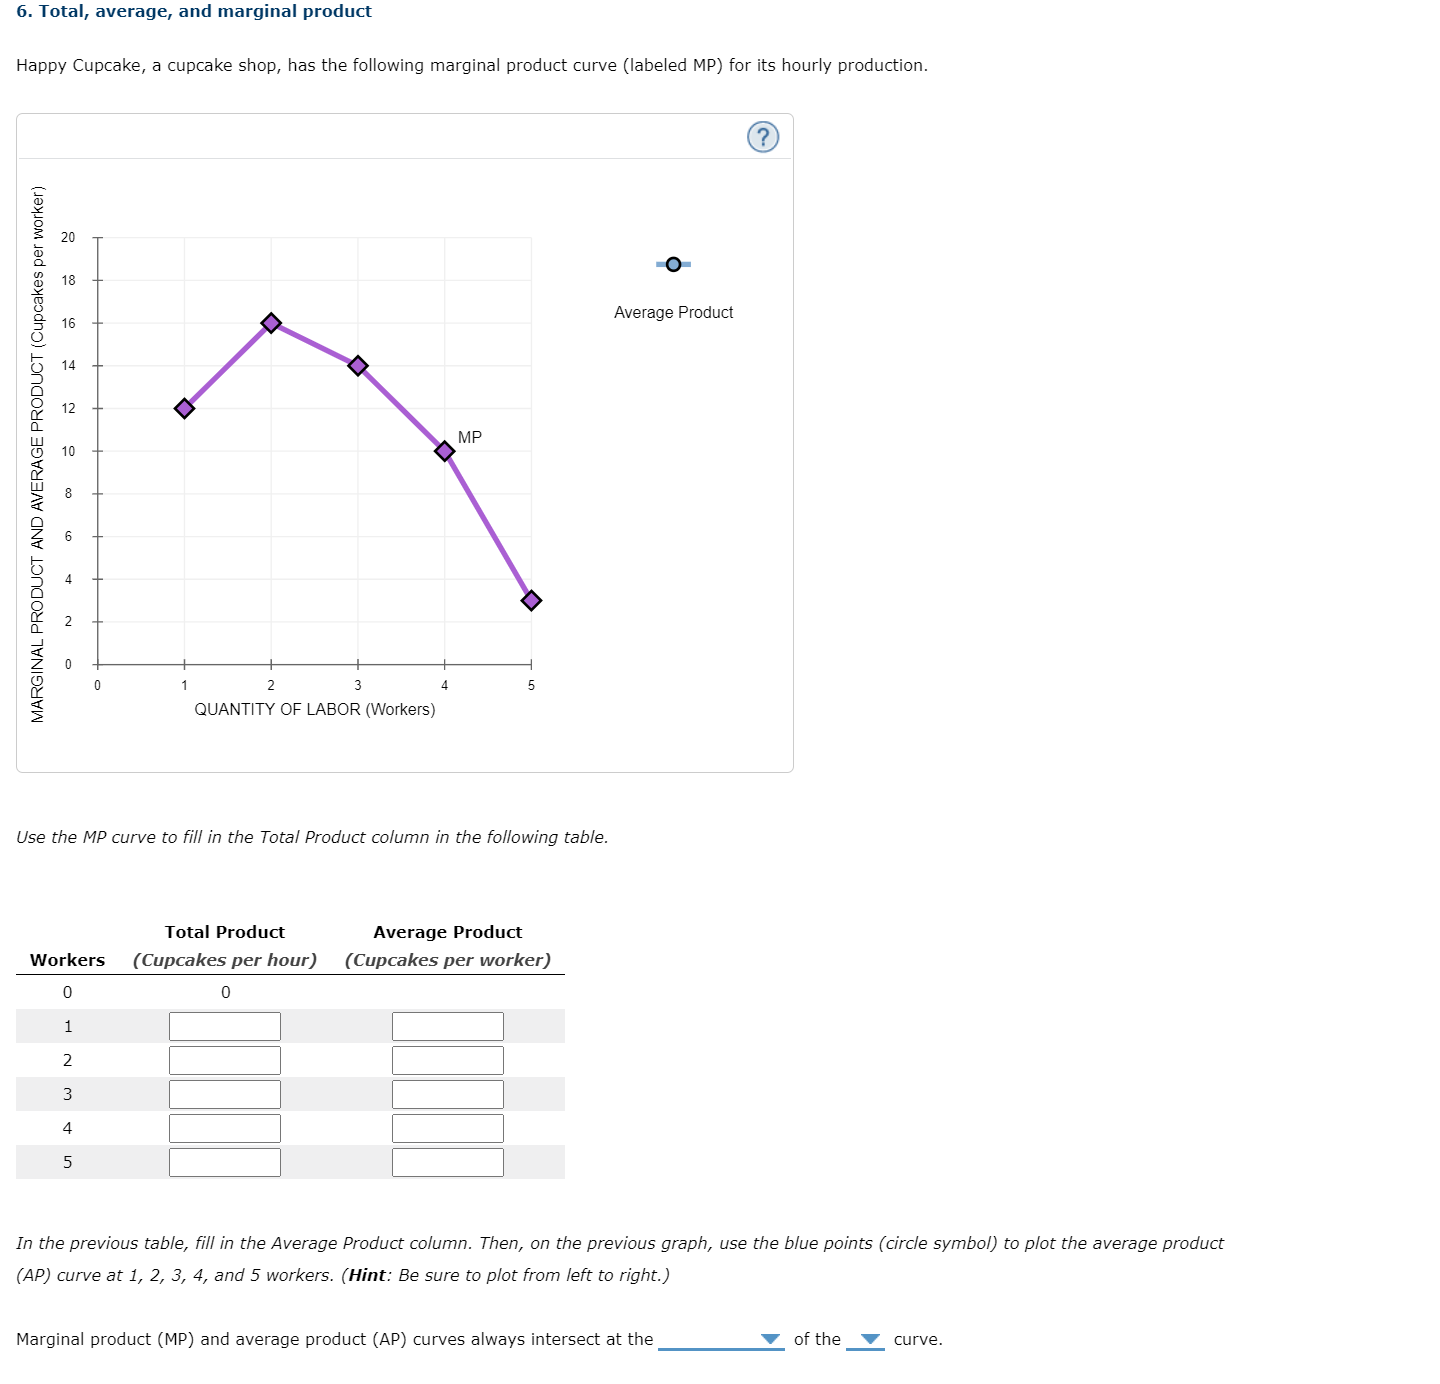
In the previous table, fill in the Average Product column. Then, on the previous minimum he blue points (circle symbol) to plot the average product (AP) curve at 1, 2, 3, 4, and 5 workers. (Hint: Be sure to plot from left to right maximum Marginal product (MP) and average product (AP) curves always intersect at the of the curve.6. Total, average, and marginal product Happy Cupcake, a cupcake shop, has the following marginal product curve (labeled MP) for its hourly production. ('2) 2|) -O- 18 16 Average Product 14 12 MP 10 (l l | | l l U 1 2 3 4 5 QUANTITY OF LABOR (Workers) MARGINAL PRODUCT AND AVERAGE PRODUCT (Cupcakes per worker) Use the MP curve to ll in the Total Product column in the following table. Total Product Average Product Workers {Cupcakes per hour) { Cupcakes per worker) D HUM HUM 1 2 3 4 5 In the previous table, ll in the Average Product column. Then, on the previous graph, use the blue po AP le symbol) to plot the average product (AP) curve at 1, 2, 3, 4, and 5 workers. (Hint: Be sure to plot from left to right.) MP Marginal product (MP) and average product (AP) curves always intersect at the V of the V curve. 6. Total, average, and marginal product Happy Cupcake, a cupcake shop, has the following marginal product curve (labeled MP) for its hourly production. MARGINAL PRODUCT AND AVERAGE PRODUCT (Cupcakes per worker) O Average Product MP ON QUANTITY OF LABOR (Workers) Use the MP curve to fill in the Total Product column in the following table. Total Product Average Product Workers (Cupcakes per hour) (Cupcakes per worker) 0 W N In the previous table, fill in the Average Product column. Then, on the previous graph, use the blue points (circle symbol) to plot the average product (AP) curve at 1, 2, 3, 4, and 5 workers. (Hint: Be sure to plot from left to right.) Marginal product (MP) and average product (AP) curves always intersect at the of the curve
Step by Step Solution
There are 3 Steps involved in it

Get step-by-step solutions from verified subject matter experts