

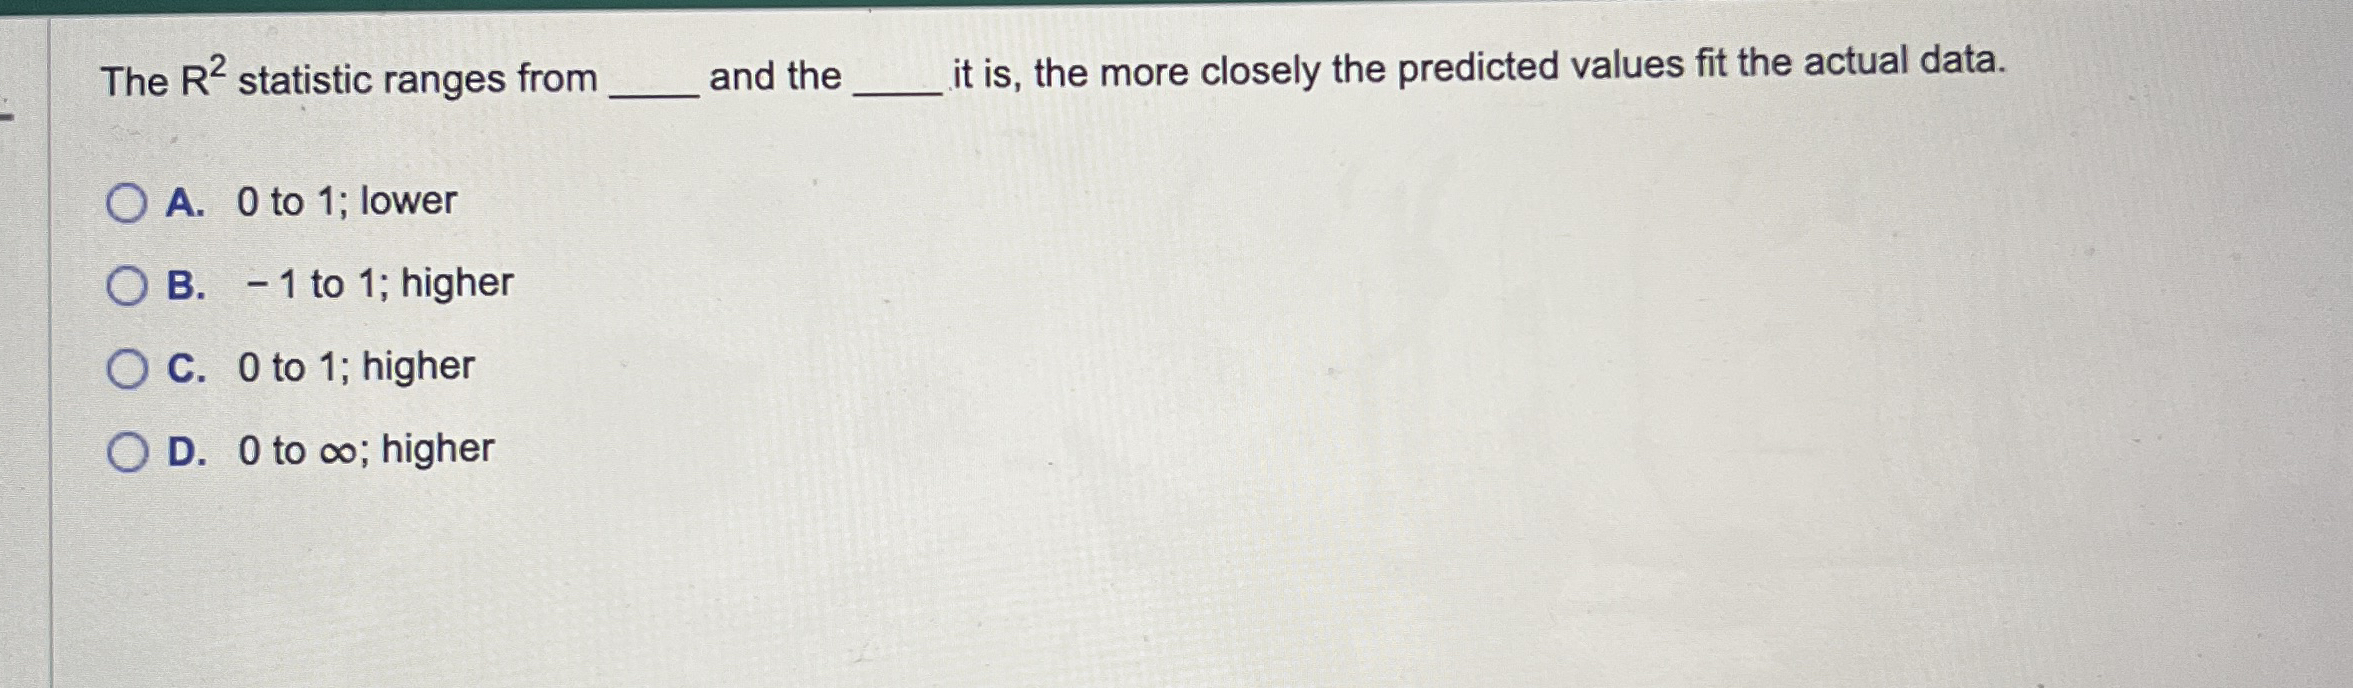
Question: The R 2 statistic ranges from q , and the q , it is , the more closely the predicted values fit the actual data.
The statistic ranges from and the it is the more closely the predicted values fit the actual data.
A to ; lower
B to ; higher
C to ; higher
D to ; higher
Step by Step Solution
There are 3 Steps involved in it
1 Expert Approved Answer
Step: 1 Unlock

Question Has Been Solved by an Expert!
Get step-by-step solutions from verified subject matter experts
Step: 2 Unlock
Step: 3 Unlock