

Question: The red curve is the position-time x-t graph for the ladybug. Each tick mark on the time axis of the graph marks off 0.5 s.
The red curve is the position-time x-t graph for the ladybug. Each tick mark on the time axis of the graph marks off 0.5 s. Note: you can hit reset graph and graph again to watch the graph form again and again.
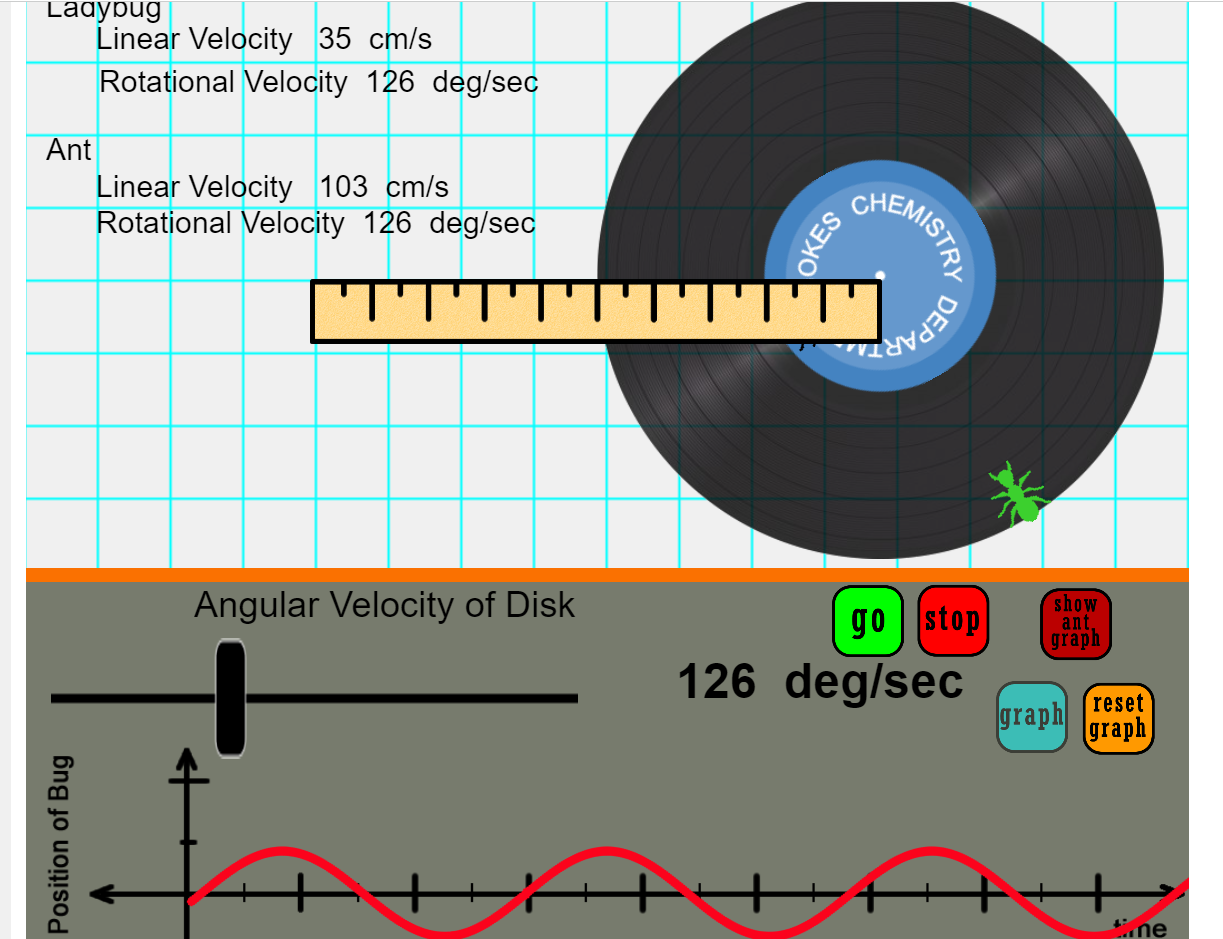
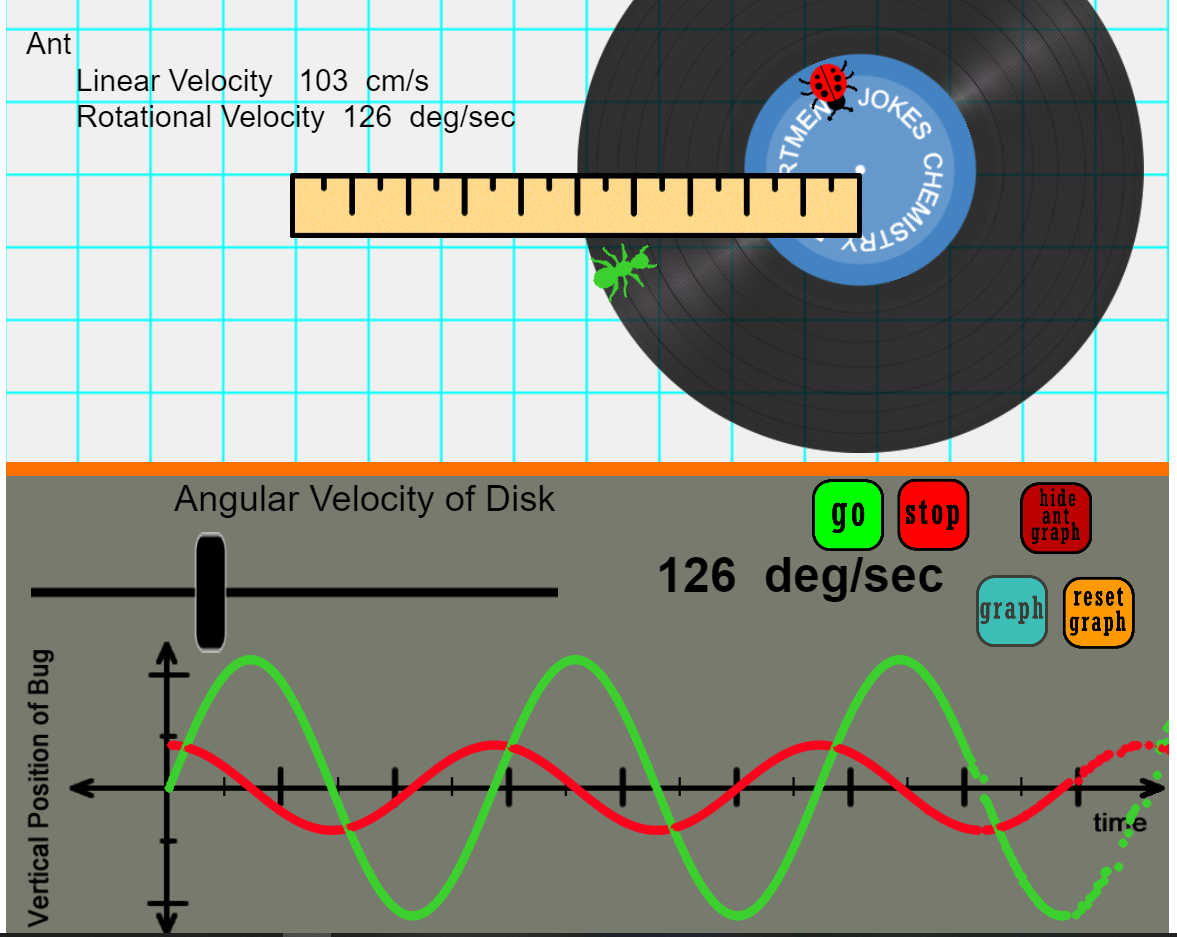
CHEMISTRY Ladybug Ant Linear Velocity 35 cm/s Rotational Velocity 126 deg/sec Linear Velocity 103 cm/s Rotational Velocity 126 deg/sec OKES 'T'T'T' Angular Velocity of Disk go stop show ant, graph 126 deg/sec graph reset graph T: Position of Bug ne
Step by Step Solution
There are 3 Steps involved in it
1 Expert Approved Answer
Step: 1 Unlock

Question Has Been Solved by an Expert!
Get step-by-step solutions from verified subject matter experts
Step: 2 Unlock
Step: 3 Unlock