Question: The red X means i got the answer wrong. Please show work Enterprise Industries produces Fresh, a brand of liquid laundry detergent. In order to
 The red X means i got the answer wrong. Please show work
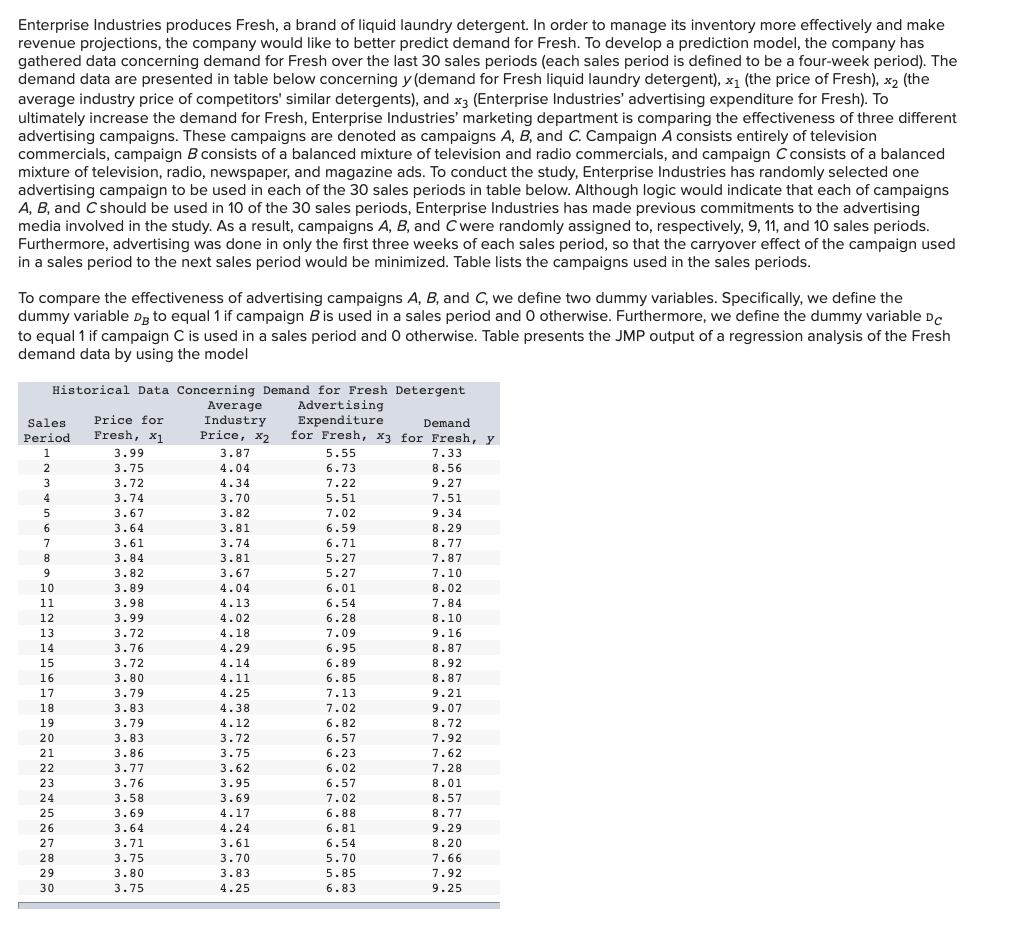
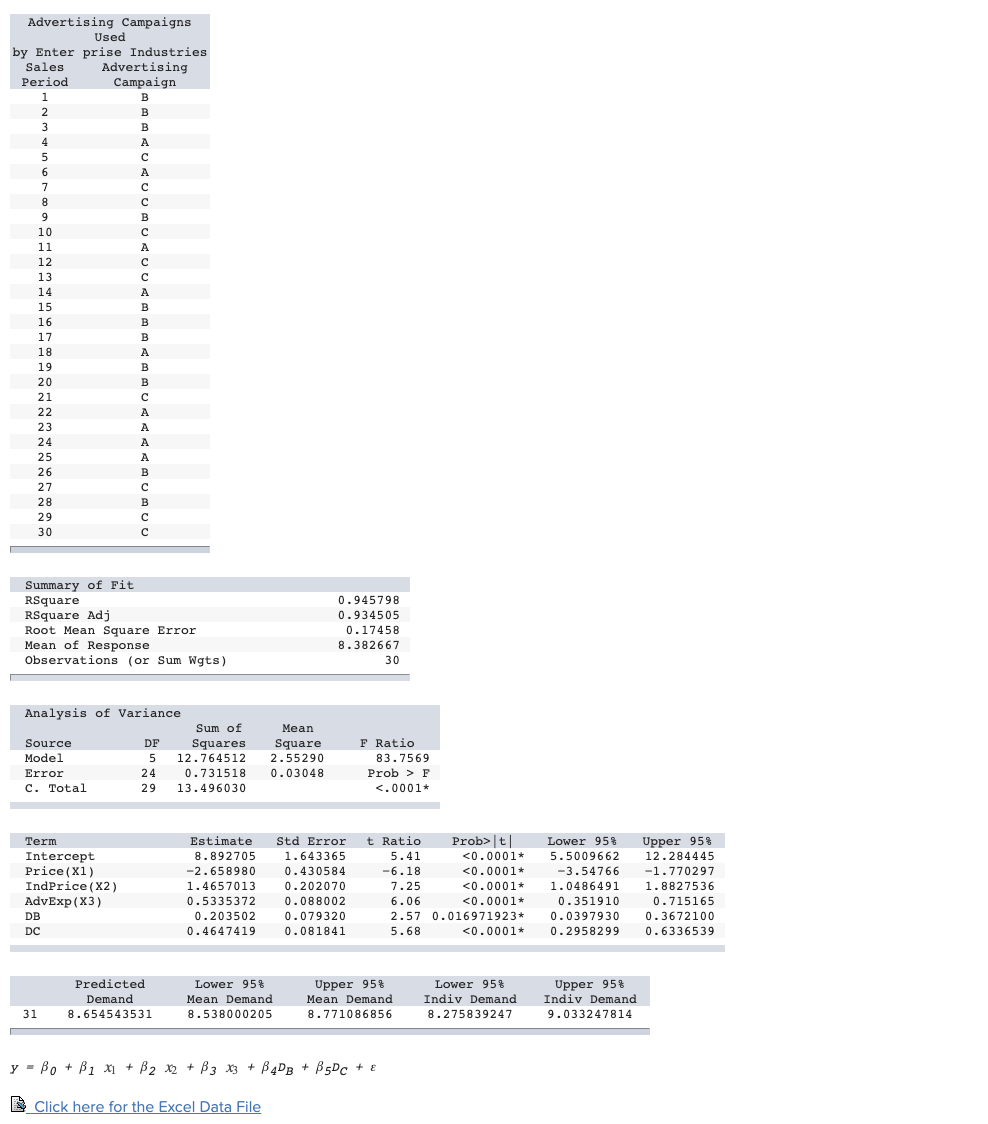
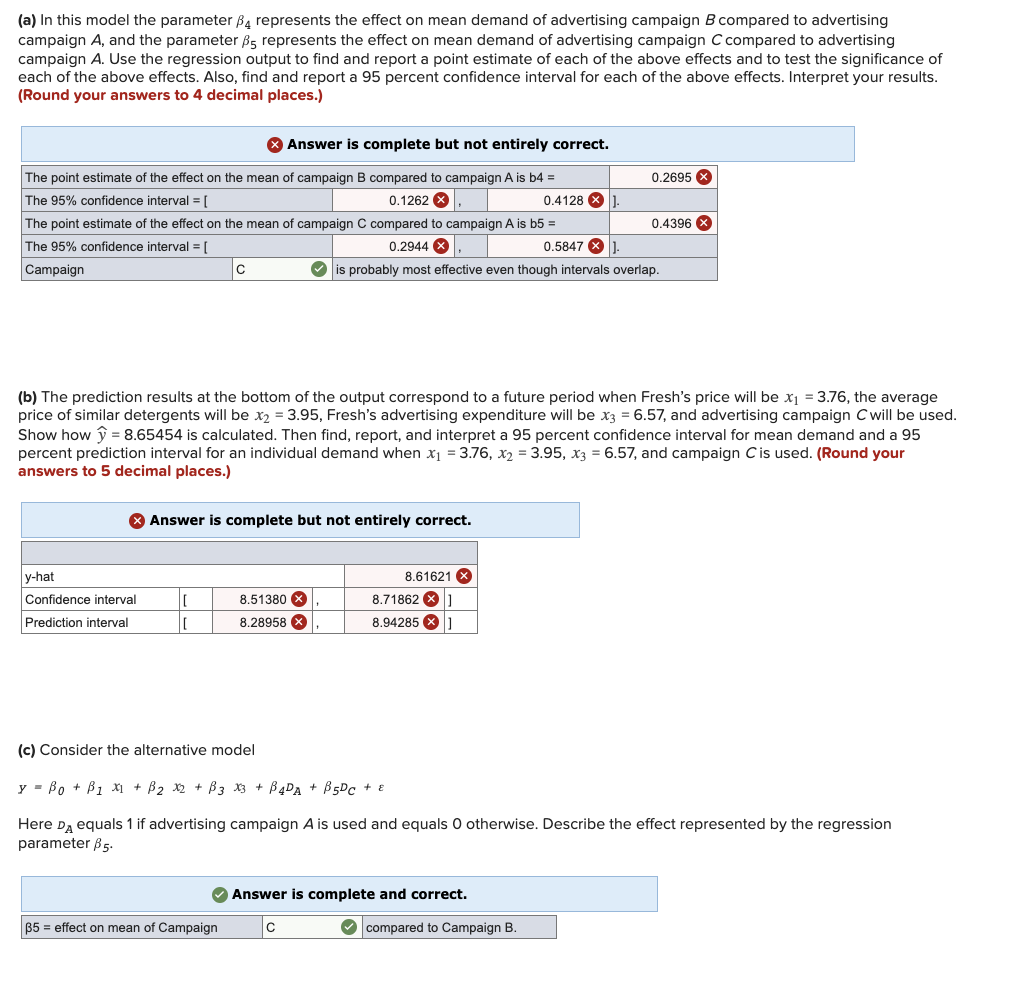
Enterprise Industries produces Fresh, a brand of liquid laundry detergent. In order to manage its inventory more effectively and make revenue projections, the company would like to better predict demand for Fresh. To develop a prediction model, the company has demand data are presented in table below concerning y (demand for Fresh liquid laundry detergent), x1 (the price of Fresh), x2 (the average industry price of competitors' similar detergents), and x3 (Enterprise Industries' advertising expenditure for Fresh). To advertising campaigns. These campaigns are denoted as campaigns A,B, and C. Campaign A consists entirely of television mixture of television, radio, newspaper, and magazine ads. To conduct the study, Enterprise Industries has randomilected one advertising campaign to be used in each of the 30 sales periods in table below. Although logic would indicate that each of campaigns A,B, and C should be used in 10 of the 30 sales periods, Enterprise Industries has made previous commitments to the advertising media involved in the study. As a result, campaigns A,B, and C were randomly assigned to, respectively, 9 , 11 , and 10 sales periods. in a sales period to the next sales period would be minimized. Table lists the campaigns used in the sales periods. To compare the effectiveness of advertising campaigns A,B, and C, we define two dummy variables. Specifically, we define the dummy variable DB to equal 1 if campaign B is used in a sales period and 0 otherwise. Furthermore, we define the dummy DC demand data by using the model y=0+1x1+2x2+3x3+4DB+5DC+ Click here for the Excel Data File (a) In this model the parameter 4 represents the effect on mean demand of advertising campaign B compared to advertising campaign A, and the parameter 5 represents the effect on mean demand of advertising campaign C compared to advertising campaign A. Use the regression output to find and report a point estimate of each of the above effects and to test the significance of each of the above effects. Also, find and report a 95 percent confidence interval for each of the above effects. Interpret your results. (Round your answers to 4 decimal places.) (b) The prediction results at the bottom of the output correspond to a future period when Fresh's price will be x1=3.76, the average price of similar detergents will be x2=3.95, Fresh's advertising expenditure will be x3=6.57, and advertising campaign C will be used. Show how y^=8.65454 is calculated. Then find, report, and interpret a 95 percent confidence interval for mean demand and a 95 percent prediction interval for an individual demand when x1=3.76,x2=3.95,x3=6.57, and campaign C is used. (Round your answers to 5 decimal places.) (c) Consider the alternative model y=0+1x1+2x2+3x3+4DA+5DC+ Here DA equals 1 if advertising campaign A is used and equals 0 otherwise. Describe the effect represented by the regression parameter 5


