

Question: The residuals by predicted plot for House Price data is shown below: Residuals Plot 150000 100000 50000 Residuals 0 50000 20000 8000 200600 250000 300000
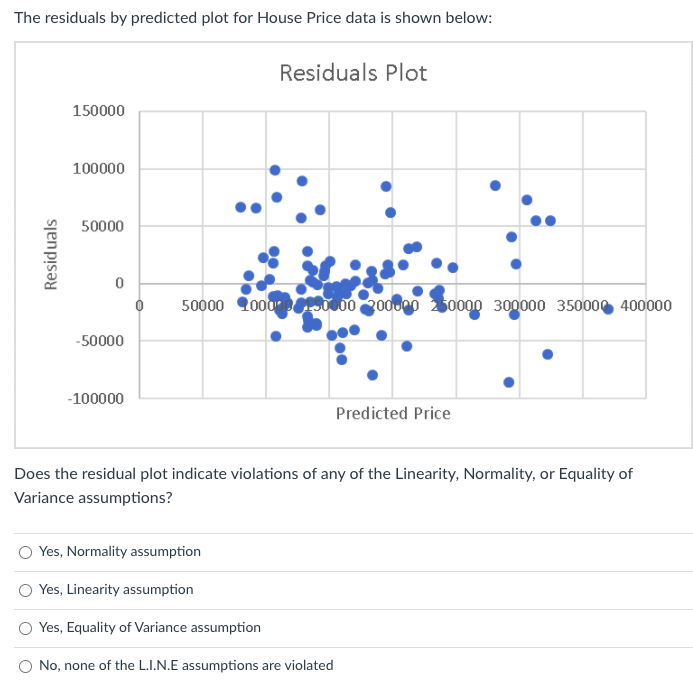
The residuals by predicted plot for House Price data is shown below: Residuals Plot 150000 100000 50000 Residuals 0 50000 20000 8000 200600 250000 300000 350000 400000 -50000 -100000 Predicted Price Does the residual plot indicate violations of any of the Linearity, Normality, or Equality of Variance assumptions? O Yes, Normality assumption O Yes, Linearity assumption O Yes, Equality of Variance assumption O No, none of the L.I.N.E assumptions are violated
Step by Step Solution
There are 3 Steps involved in it
1 Expert Approved Answer
Step: 1 Unlock

Question Has Been Solved by an Expert!
Get step-by-step solutions from verified subject matter experts
Step: 2 Unlock
Step: 3 Unlock