

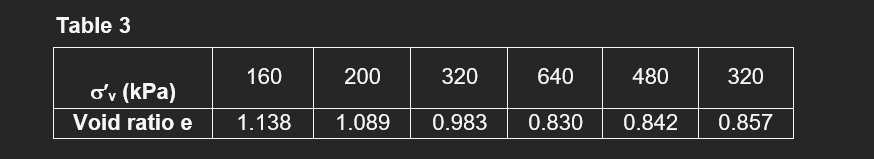
Question: The results obtained from an oedometer test on a sample of clay are given in Table 3 below: Table 3 table [ [
The results obtained from an oedometer test on a sample of clay are given in Table below:
Table
tablesigma vkPaVoid ratio e
a Plot a graph of the void ratio against the logarithm of the vertical effective stress. Indicate the onedimensional normal compression line on the graph.
b Calculate the preconsolidation pressure and determine the slopes of the onedimensional normal compression and unloadingreloading lines.
c A m thick layer of the clay from parts a and b lies below a layer of sand of m depth from the ground surface. The water table is at the ground surface. The saturated unit weight of both soil layers is kNm A new office building will be constructed at this site. The building will have a raft foundation which will increase the vertical effective stress in the clay layer by kPa throughout its depth. A soil sample with an initial height of mm was taken from the middepth of the clay layer and was tested in the oedometer apparatus; the results obtained are given in Table Assuming the unit weight of water is equal to kNm determine the final settlement due to the consolidation of the clay.
Step by Step Solution
There are 3 Steps involved in it
1 Expert Approved Answer
Step: 1 Unlock

Question Has Been Solved by an Expert!
Get step-by-step solutions from verified subject matter experts
Step: 2 Unlock
Step: 3 Unlock