

Question: Auditing Determining Sample Size for Attributes Sampling ARO of 5% Estimated Population Exception Rate (in Percent) 0.00 0.25 0.50 0.75 1.00 1.25 1.50 1.75 2.00


Auditing


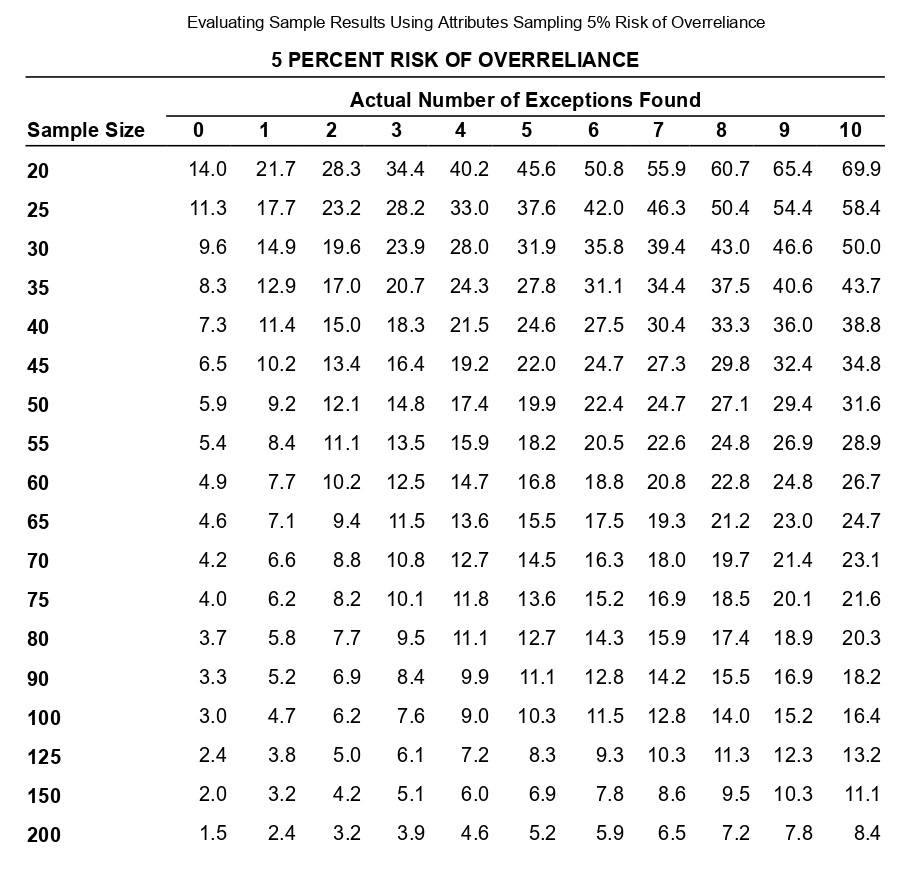
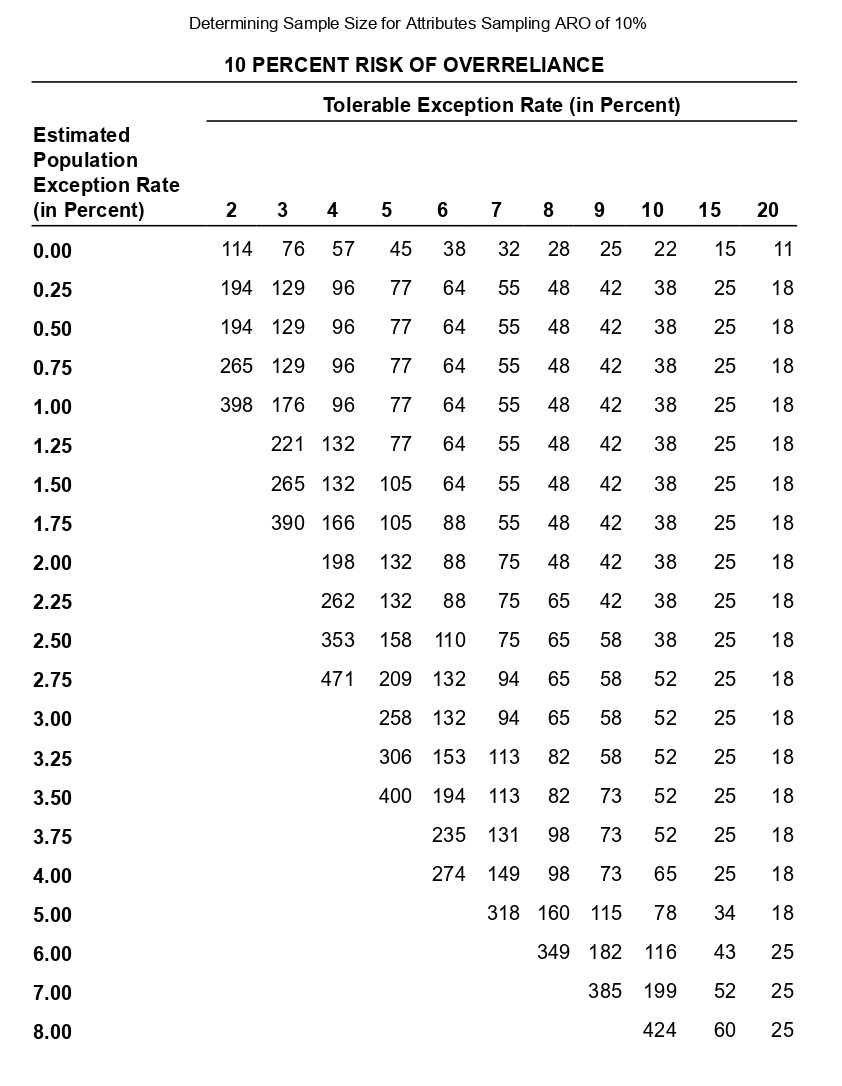

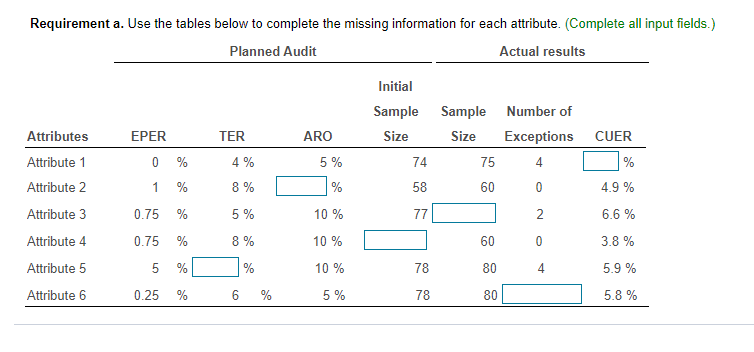


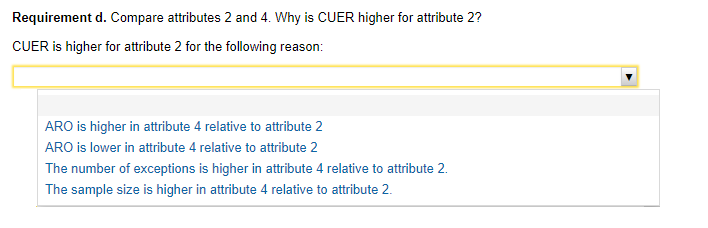
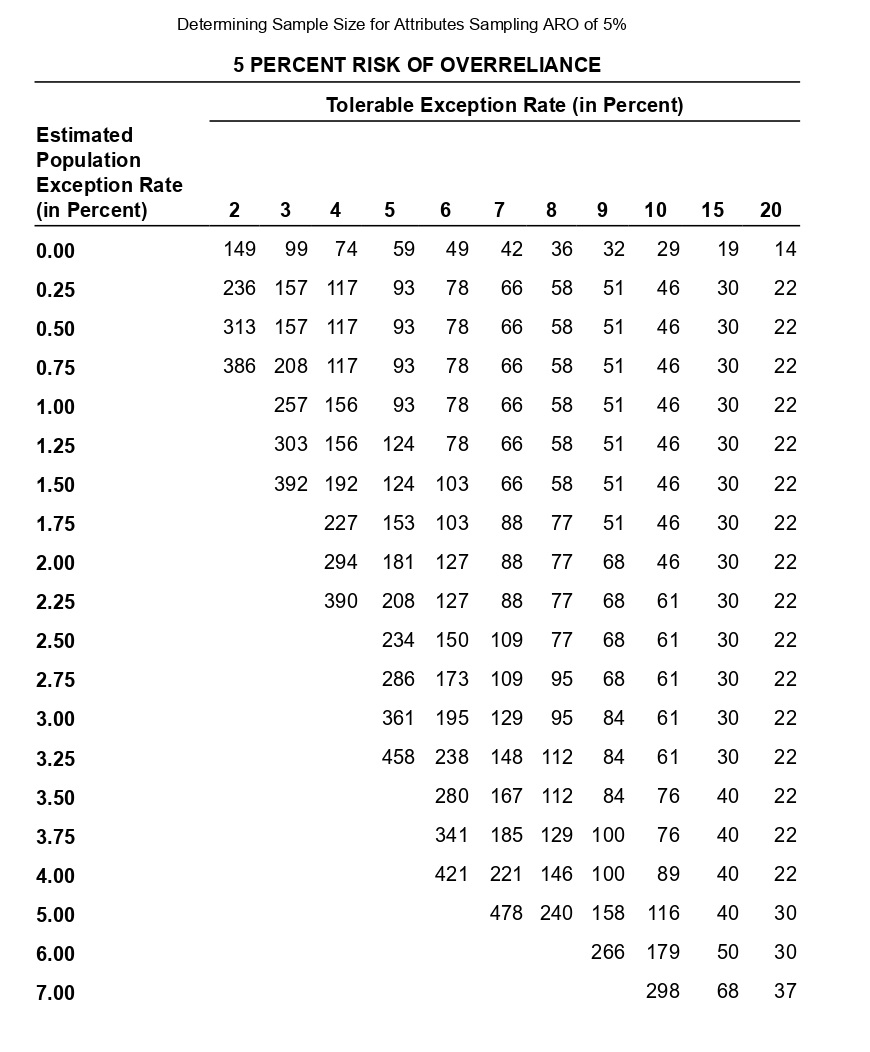
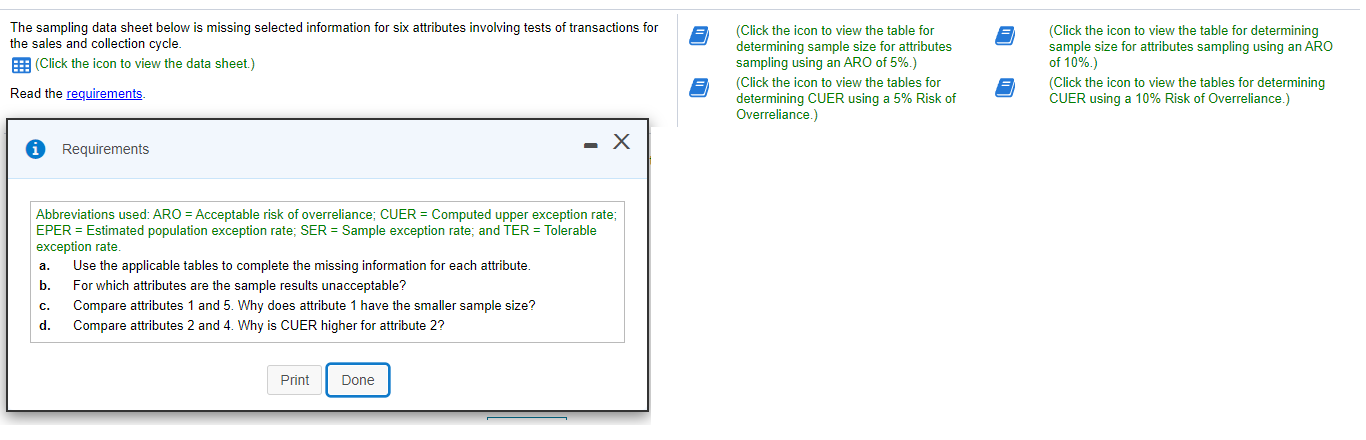
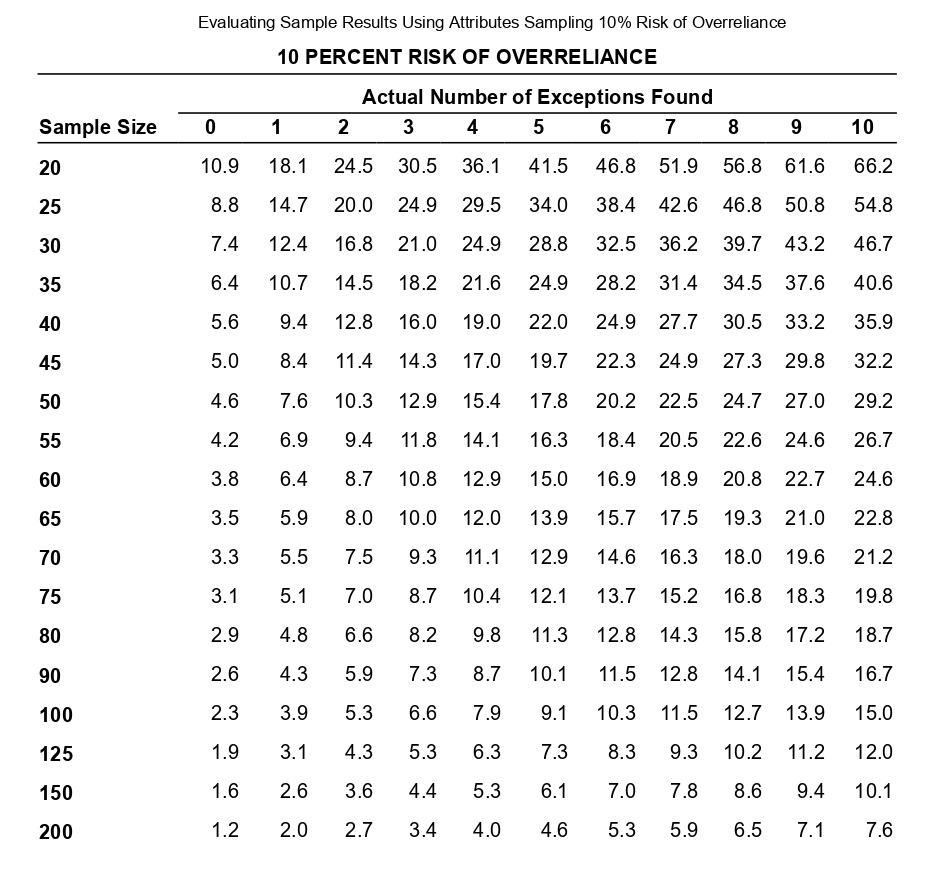
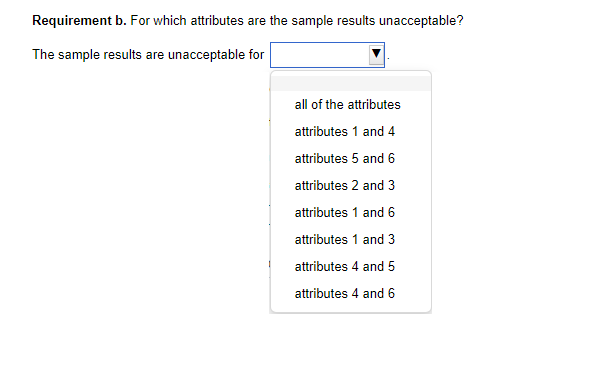
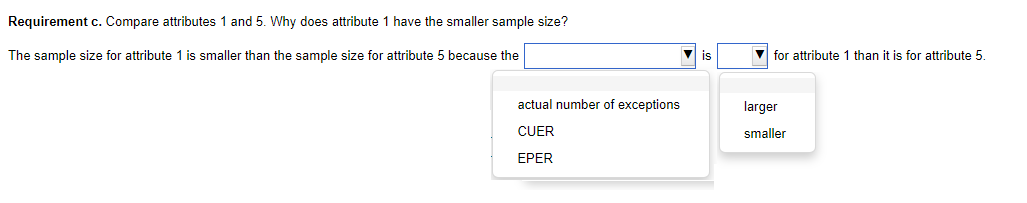
Determining Sample Size for Attributes Sampling ARO of 5% Estimated Population Exception Rate (in Percent) 0.00 0.25 0.50 0.75 1.00 1.25 1.50 1.75 2.00 2.25 2.50 2.75 3.00 3.25 3.50 3.75 4.00 5.00 6.00 7.00 5 PERCENT RISK OF OVERRELIANCE 149 236 313 386 99 157 157 208 257 303 392 Tolerable Exception Rate (in Percent) 74 117 117 117 156 156 192 227 294 390 59 93 93 93 93 124 124 153 181 208 234 286 361 458 6 49 78 78 78 78 78 103 103 127 127 150 173 195 238 280 341 421 7 42 66 66 66 66 66 66 88 88 88 109 109 129 148 167 185 221 8 36 58 58 58 58 58 58 77 77 77 77 95 95 112 112 129 146 478 240 9 32 51 51 51 51 51 51 51 68 68 68 68 84 84 84 100 100 158 266 10 29 46 46 46 46 46 46 46 46 61 61 61 61 61 76 76 89 116 179 298 15 19 30 30 30 30 30 30 30 30 30 30 30 30 30 40 40 40 40 50 68 20 14 22 22 22 22 22 22 22 22 22 22 22 22 22 22 22 22 30 30 37 The sampling data sheet below is missing selected information for six attributes involving tests of transactions for Click the icon to view the table for Click the icon to view the table for determining the sales and collection cycle. determining sample size for attributes sample size for attributes sampling using an ARO (Click the icon to view the data sheet.) sampling using an ARO of 5%.) of 10%.) (Click the icon to view the tables for Click the icon to view the tables for determining Read the requirements. determining CUER using a 5% Risk of CUER using a 10% Risk of Overreliance.) Overreliance.) i Requirements - X Abbreviations used: ARO = Acceptable risk of overreliance; CUER = Computed upper exception rate; EPER = Estimated population exception rate; SER = Sample exception rate; and TER = Tolerable exception rate. a. Use the applicable tables to complete the missing information for each attribute. b. For which attributes are the sample results unacceptable? C. Compare attributes 1 and 5. Why does attribute 1 have the smaller sample size? d. Compare attributes 2 and 4. Why is CUER higher for attribute 2? Print DoneEvaluating Sample Results Using Attributes Sampling 5% Risk of Overrelianpe 5 PERCENT RISK OF OVERRELIANCE Actual Number of Exceptions Found Sample Size 0 1 2 3 4 5 6 7 8 9 10 20 14.0 21.7 28.3 34.4 40.2 45.6 50.8 55.9 60.7 65.4 69.9 25 11.3 17.7 23.2 28.2 33.0 37.6 42.0 46.3 50.4 54.4 58.4 30 9.6 14.9 19.6 23.9 28.0 31.9 35.8 39.4 43.0 46.6 50.0 35 8.3 12.9 17.0 20.7 24.3 27.8 31.1 34.4 37.5 40.6 43.7 40 7.3 11.4 15.0 18.3 21.5 24.6 27.5 30.4 33.3 36.0 38.8 45 6.5 10.2 13.4 16.4 19.2 22.0 24.7 27.3 29.8 32.4 34.8 50 5.9 9.2 12.1 14.8 17.4 19.9 22.4 24.7 27.1 29.4 31.6 55 5.4 8.4 11.1 13.5 15.9 18.2 20.5 22.6 24.8 26.9 28.9 60 4.9 7.7 10.2 12.5 14.7 16.8 18.8 20.8 22.8 24.8 26.7 65 4.6 7.1 9.4 11.5 13.6 15.5 17.5 19.3 21.2 23.0 24.7 70 4.2 6.6 8.8 10.8 12.7 14.5 16.3 18.0 19.7 21.4 23.1 75 4.0 6.2 8.2 10.1 11.8 13.6 15.2 16.9 18.5 20.1 21.6 80 3.7 5.8 7.7 9.5 11.1 12.7 14.3 15.9 17.4 18.9 20.3 90 3.3 5.2 6.9 8.4 9.9 11.1 12.8 14.2 15.5 16.9 18.2 100 3.0 4.7 6.2 7.6 9.0 10.3 11.5 12.8 14.0 15.2 16.4 125 2.4 3.8 5.0 6.1 7.2 8.3 9.3 10.3 11.3 12.3 13.2 150 2.0 3.2 4.2 5.1 6.0 6.9 7.8 8.6 9.5 10.3 11.1 200 1.5 2.4 3.2 3.9 4.6 5.2 5.9 6.5 7.2 7.8 8.4 Determining Sample Size for Attributes Sampling ARO of 10% 10 PERCENT RISK OF OVERRELIANCE Tolerable Exception Rate (in Percent) Estimated Population Exception Rate (in Percent) 2 3 4 5 6 7 8 9 1 0 1 5 20 0.00 114 76 57 45 38 32 28 25 22 15 11 0.25 194 129 96 77 64 55 48 42 38 25 18 0.50 194 129 96 77 64 55 48 42 38 25 18 0.75 265 129 96 77 64 55 48 42 38 25 18 1.00 398 176 96 77 64 55 48 42 38 25 18 1.25 221 132 77 64 55 48 42 38 25 18 1.50 265 132 105 64 55 48 42 38 25 18 1.75 390 166 105 88 55 48 42 38 25 18 2.00 198 132 88 75 48 42 38 25 18 2.25 262 132 88 75 65 42 38 25 18 2.50 353 158 110 75 65 58 38 25 18 2.75 471 209 132 94 65 58 52 25 18 3.00 258 132 94 65 58 52 25 18 3.25 306 153 113 82 58 52 25 18 3.50 400 194 113 82 73 52 25 18 3.75 235 131 98 73 52 25 18 4.00 274 149 98 73 65 25 18 5.00 318 160 115 78 34 18 6.00 349 182 116 43 25 7.00 385 199 52 25 8.00 424 60 25 Evaluating Sample Results Using Attributes Sampling 10% Risk of Overrelianoe 10 PERCENT RISK OF OVERRELIANCE Actual Number of Exceptions Found Sample Size 0 1 2 3 4 5 6 7 8 9 10 20 10.9 18.1 24.5 30.5 36.1 41.5 46.8 51.9 56.8 61.6 66.2 25 8.8 14.7 20.0 24.9 29.5 34.0 38.4 42.6 46.8 50.8 54.8 30 7.4 12.4 16.8 21.0 24.9 28.8 32.5 36.2 39.7 43.2 46.7 35 6.4 10.7 14.5 18.2 21.6 24.9 28.2 31.4 34.5 37.6 40.6 40 5.6 9.4 12.8 16.0 19.0 22.0 24.9 27.7 30.5 33.2 35.9 45 5.0 8.4 11.4 14.3 17.0 19.7 22.3 24.9 27.3 29.8 32.2 50 4.6 7.6 10.3 12.9 15.4 17.8 20.2 22.5 24.7 27.0 29.2 55 4.2 6.9 9.4 11.8 14.1 16.3 18.4 20.5 22.6 24.6 26.7 60 3.8 6.4 8.7 10.8 12.9 15.0 16.9 18.9 20.8 22.7 24.6 65 3.5 5.9 8.0 10.0 12.0 13.9 15.7 17.5 19.3 21.0 22.8 70 3.3 5.5 7.5 9.3 11.1 12.9 14.6 16.3 18.0 19.6 21.2 75 3.1 5.1 7.0 8.7 10.4 12.1 13.7 15.2 16.8 18.3 19.8 80 2.9 4.8 6.6 8.2 9.8 11.3 12.8 14.3 15.8 17.2 18.7 90 2.6 4.3 5.9 7.3 8.7 10.1 11.5 12.8 14.1 15.4 16.7 100 2.3 3.9 5.3 6.6 7.9 9.1 10.3 11.5 12.7 13.9 15.0 125 1.9 3.1 4.3 5.3 6.3 7.3 8.3 9.3 10.2 11.2 12.0 150 1.6 2.6 3.6 4.4 5.3 6.1 7.0 7.8 8.6 9.4 10.1 200 1.2 2.0 2.7 3.4 4.0 4.6 5.3 5.9 6.5 7.1 7.6 Requirement a. Use the tables below to complete the missing information for each attribute. (Complete all input fields.) Planned Audit Actual results Initial Sample Sample Number of Attributes EPER TER ARO Size Size Exceptions CUER Attribute 1 0 % 4 % 5 % 74 75 4 % Attribute 2 1 8 % % 58 60 0 4.9% Attribute 3 0.75 5 % 10 % 77 2 6.6 % Attribute 4 0.75 8 % 10 % 60 0 3.8 % Attribute 5 5 % 10 % 78 80 4 5.9% Attribute 6 0.25 % 6 % 5% 78 80 5.8%Requirement b. For which attributes are the sample results unacceptable? The sample results are unacceptable for all of the attributes attributes 1 and 4 attributes 5 and 6 attributes 2 and 3 attributes 1 and 6 attributes 1 and 3 attributes 4 and 5 attributes 4 and 6Requirement c. Compare attributes 1 and 5. Why does attribute 1 have the smaller sample size? The sample size for attribute 1 is smaller than the sample size for attribute 5 because the is for attribute 1 than it is for attribute 5. actual number of exceptions larger CUER smaller EPERRequirement d. lCompare attributes 2 and :1. Why is lCUER higher for attribute 2? CU ER is higher for attribute 2 for the following reason: ARC} is higher in attribute 4 relative to attribute 2 ARC} is lower in attribute 4 relative to altribute 2 The number of exceptions is higher in attribute 4 relative to attribute 2. The sample size is higher in attribute 4 relative to attribute 2
Step by Step Solution
There are 3 Steps involved in it

Get step-by-step solutions from verified subject matter experts