

Question: The scatter plot and best-fit line show the relation among the number of cars waiting by a school (y) and the amount of time after
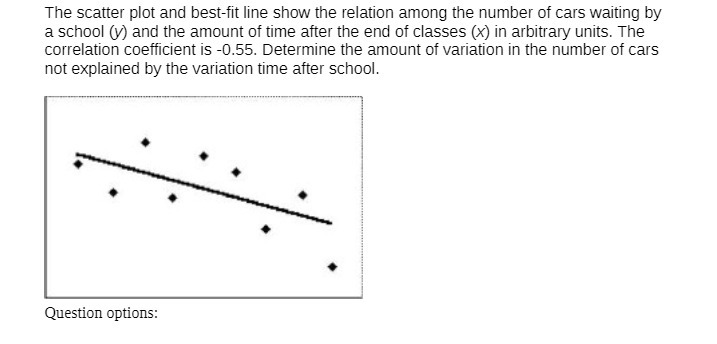
The scatter plot and best-fit line show the relation among the number of cars waiting by a school (y) and the amount of time after the end of classes (x) in arbitrary units. The correlation coefficient is -0.55. Determine the amount of variation in the number of cars not explained by the variation time after school. Question options
Step by Step Solution
There are 3 Steps involved in it
1 Expert Approved Answer
Step: 1 Unlock

Question Has Been Solved by an Expert!
Get step-by-step solutions from verified subject matter experts
Step: 2 Unlock
Step: 3 Unlock