

Question: The scatter plot and linear regression models for the yearly revenue of restaurants ( R ) and supermarkets ( S ) are given in the
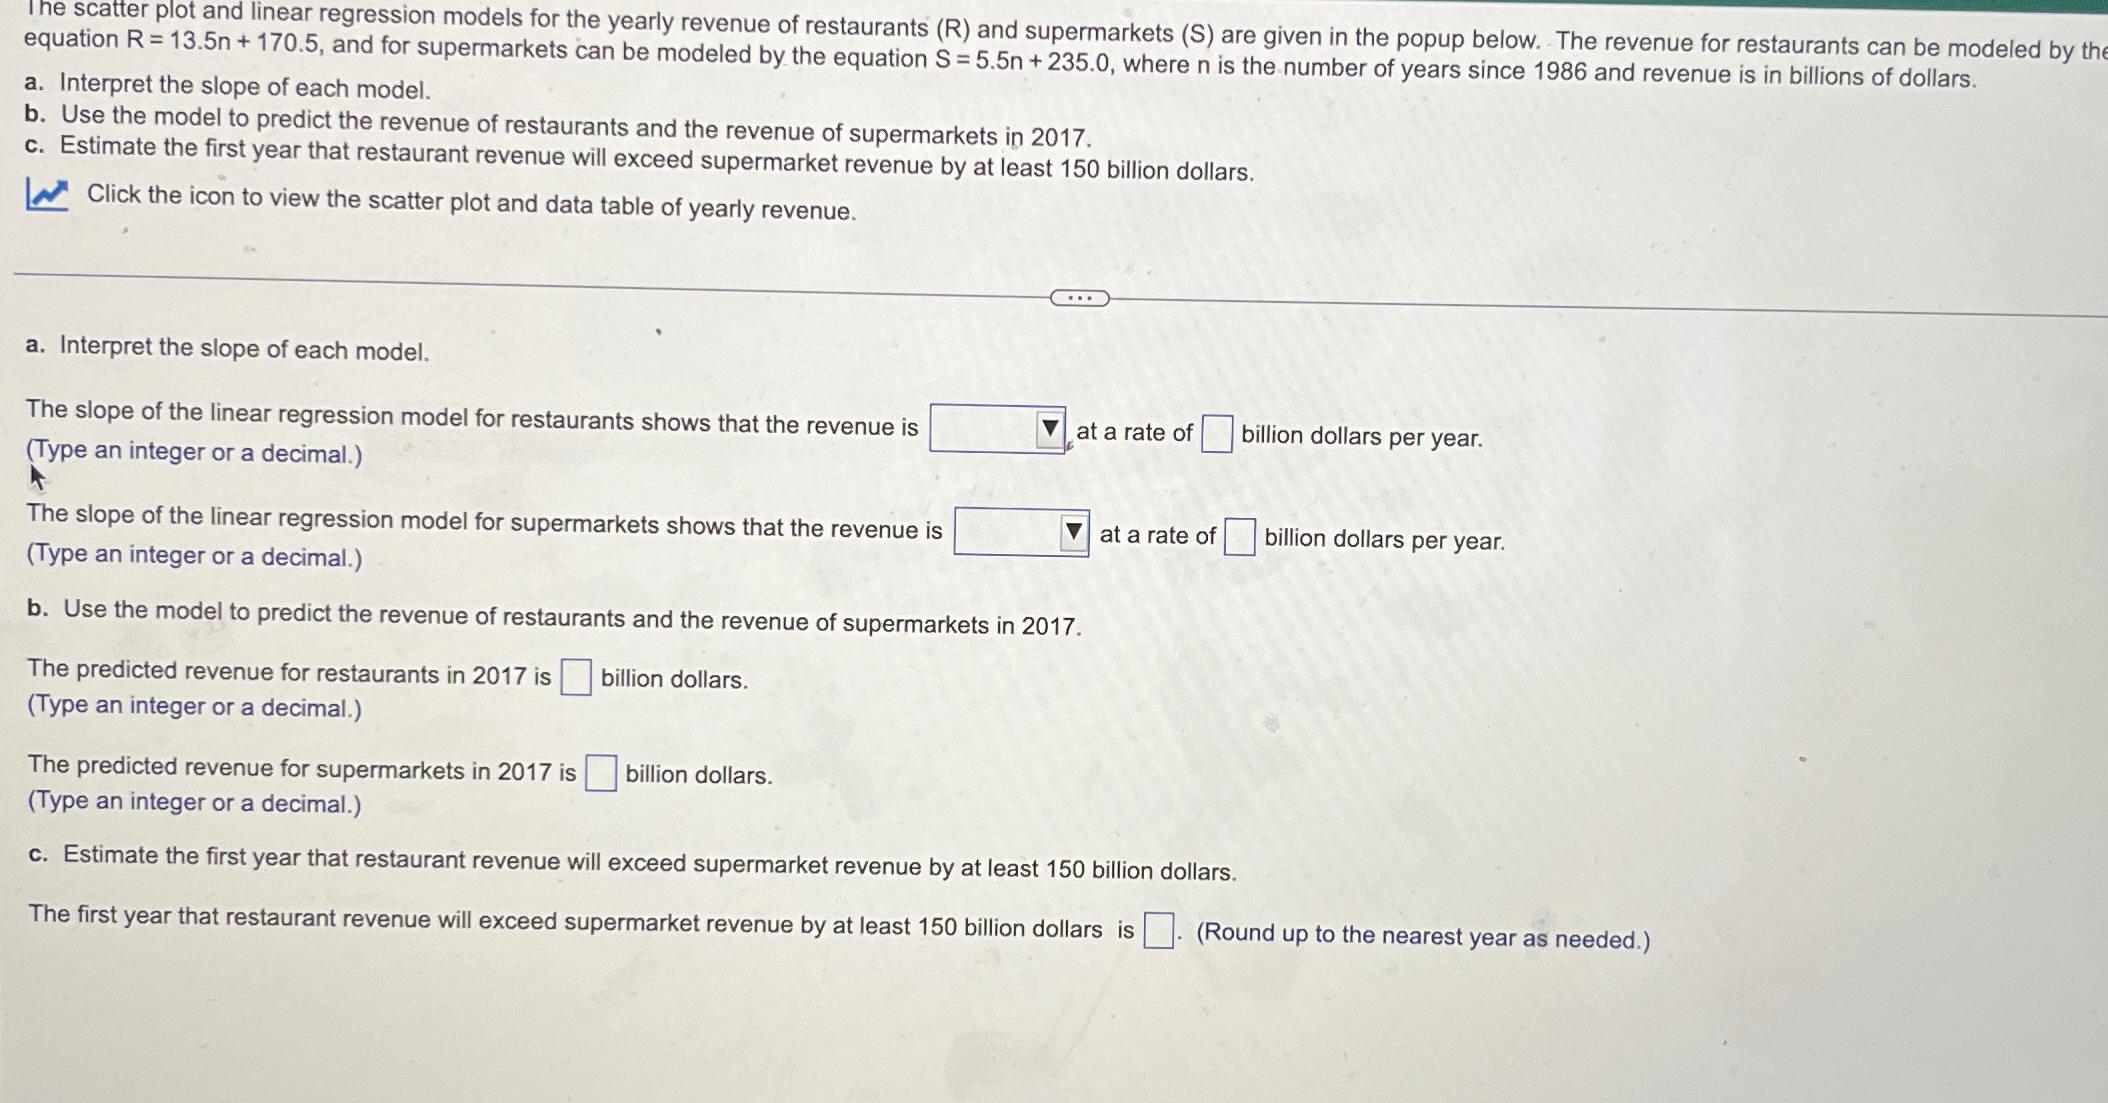
The scatter plot and linear regression models for the yearly revenue of restaurants and supermarkets are given in the popup below. The revenue for restaurants can be modeled by the equation and for supermarkets can be modeled by the equation where is the number of years since and revenue is in billions of dollars.
a Interpret the slope of each model.
b Use the model to predict the revenue of restaurants and the revenue of supermarkets in
c Estimate the first year that restaurant revenue will exceed supermarket revenue by at least billion dollars.
Click the icon to view the scatter plot and data table of yearly revenue.
a Interpret the slope of each model.
The slope of the linear regression model for restaurants shows that the revenue is Type an integer or a decimal. at a rate of billion dollars per year.
The slope of the linear regression model for supermarkets shows that the revenue is
Type an integer or a decimal. at a rate of billion dollars per year.
b Use the model to predict the revenue of restaurants and the revenue of supermarkets in
The predicted revenue for restaurants in is billion dollars.
Type an integer or a decimal.
The predicted revenue for supermarkets in is billion dollars.
Type an integer or a decimal.
c Estimate the first year that restaurant revenue will exceed supermarket revenue by at least billion dollars.
The first year that restaurant revenue will exceed supermarket revenue by at least billion dollars is Round up to the nearest year as needed.
Step by Step Solution
There are 3 Steps involved in it
1 Expert Approved Answer
Step: 1 Unlock

Question Has Been Solved by an Expert!
Get step-by-step solutions from verified subject matter experts
Step: 2 Unlock
Step: 3 Unlock