

Question: The scatter plot below reports the linear relationship between body temperatures in Farenheit and pulse rates in beats/minutes for a sample of 50 adult in
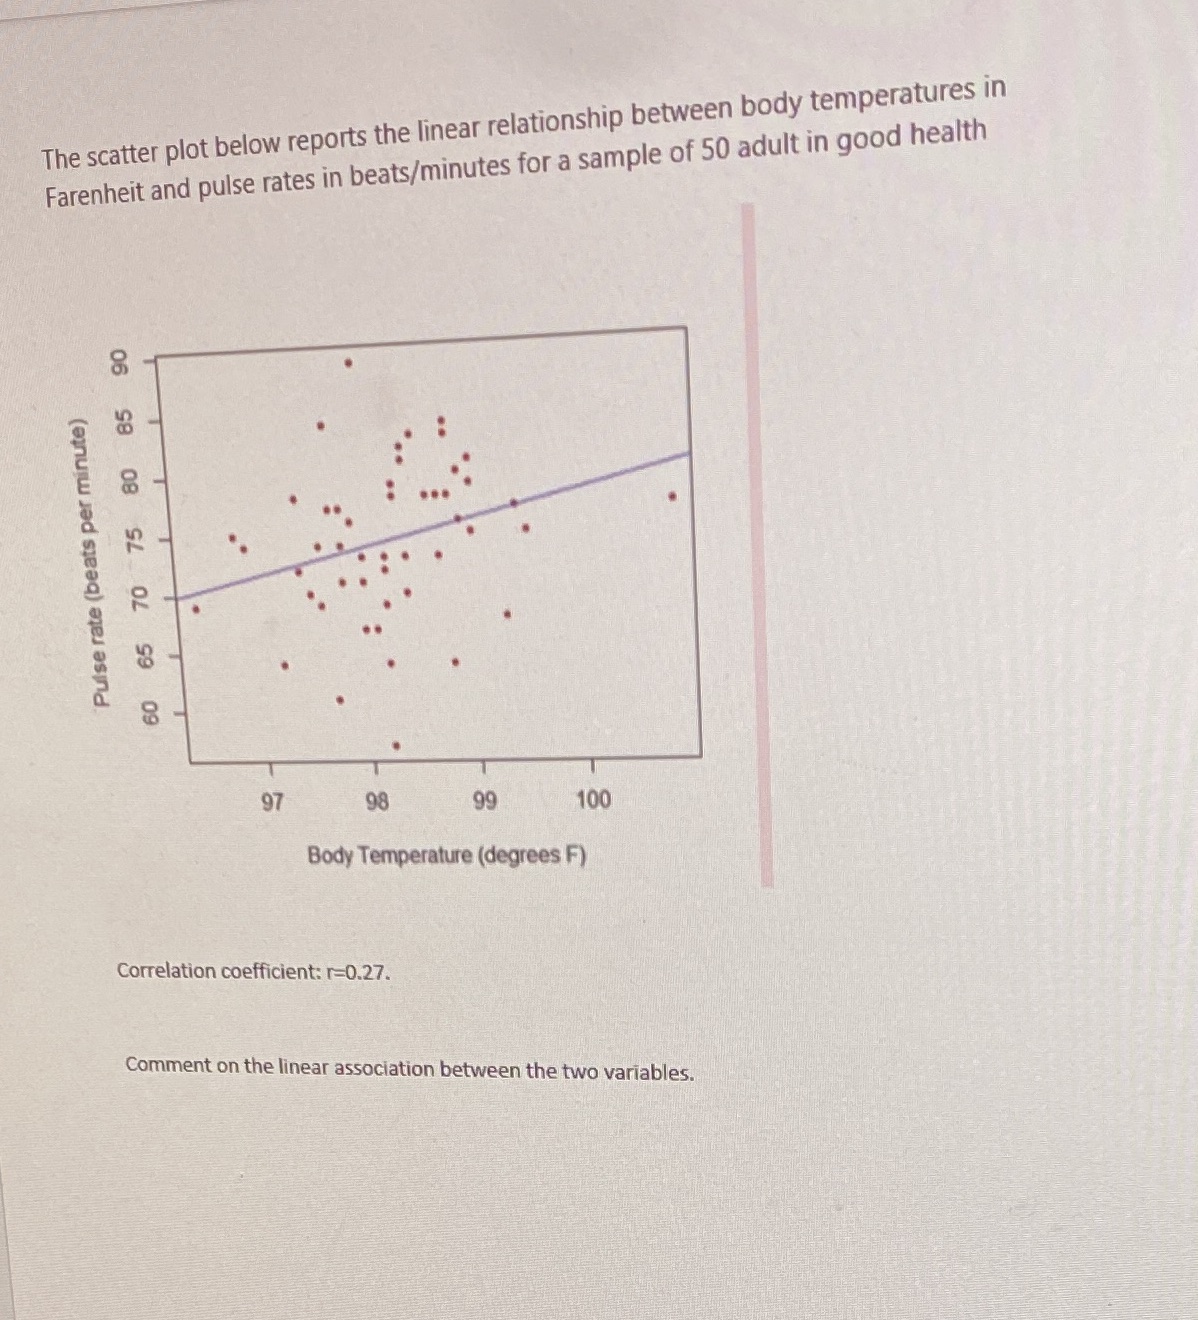
The scatter plot below reports the linear relationship between body temperatures in Farenheit and pulse rates in beats/minutes for a sample of 50 adult in good health 8 65 70 75 80 85 Pulse rate (beats per minute) 60 97 98 99 100 Body Temperature (degrees F) Correlation coefficient: r=0.27. Comment on the linear association between the two variables
Step by Step Solution
There are 3 Steps involved in it
1 Expert Approved Answer
Step: 1 Unlock

Question Has Been Solved by an Expert!
Get step-by-step solutions from verified subject matter experts
Step: 2 Unlock
Step: 3 Unlock