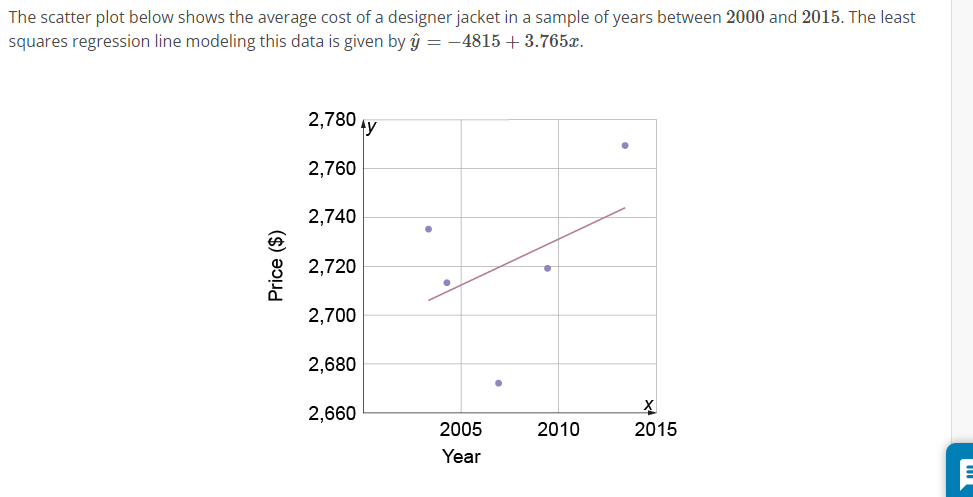
Question: The scatter plot below shows the average cost of a designer jacket in a sample of years between 2000 and 2015. The least squares regression

The scatter plot below shows the average cost ofThe scatter plot below shows the average cost of
The scatter plot below shows the average cost of a designer jacket in a sample of years between 2000 and 2015. The least squares regression line modeling this data is given by = 4815 + 3.765z. 2,780 y 2,760 2,740 2,720 . Price ($) 2,700 2,680 2660 X 2005 2010 2015 Year Interpret the y-intercept of the least squares regression line. Is it feasible? Select the correct answer below: (O The y-intercept is 4815, which is not feasible because a product cannot have a negative cost. O The y-intercept is 3.765, which is not feasible because an expensive product such as a designer jacket cannot have such a low cost. (O The y-intercept is 4815, which is feasible because it is the value from the regression equation. (O The y-intercept is 3.765 which is feasible because a product must have a positive cost

Step by Step Solution

There are 3 Steps involved in it

1 Expert Approved Answer
Step: 1 Unlock blur-text-image
Question Has Been Solved by an Expert!

Get step-by-step solutions from verified subject matter experts

Step: 2 Unlock
Step: 3 Unlock

Students Have Also Explored These Related Mathematics Questions!