

Question: The scatter plot between Height and GPA is given below. And correlation coefficient r = 0.019. What do you observe and what are your
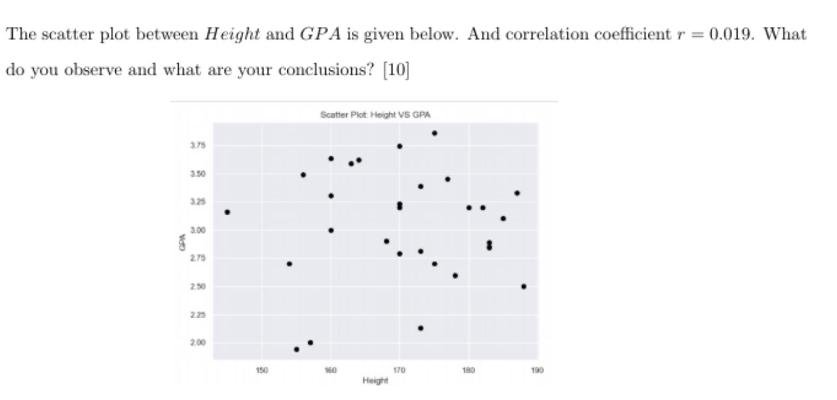
The scatter plot between Height and GPA is given below. And correlation coefficient r = 0.019. What do you observe and what are your conclusions? [10] 3.75 VOD 3.50 3.25 3.00 275 2.30 225 200 Scatter Plot: Height VS GPA 150 160 170 180 190 Height
Step by Step Solution
There are 3 Steps involved in it
1 Expert Approved Answer
Step: 1 Unlock

Observation and conclusion given in the image Weak positive correlation The graph shows very weak ... View full answer
Question Has Been Solved by an Expert!
Get step-by-step solutions from verified subject matter experts
Step: 2 Unlock
Step: 3 Unlock