

Question: The scatter plot shows the relationship between the amount of rain received in a year and the average diameter of a fruit in a particular

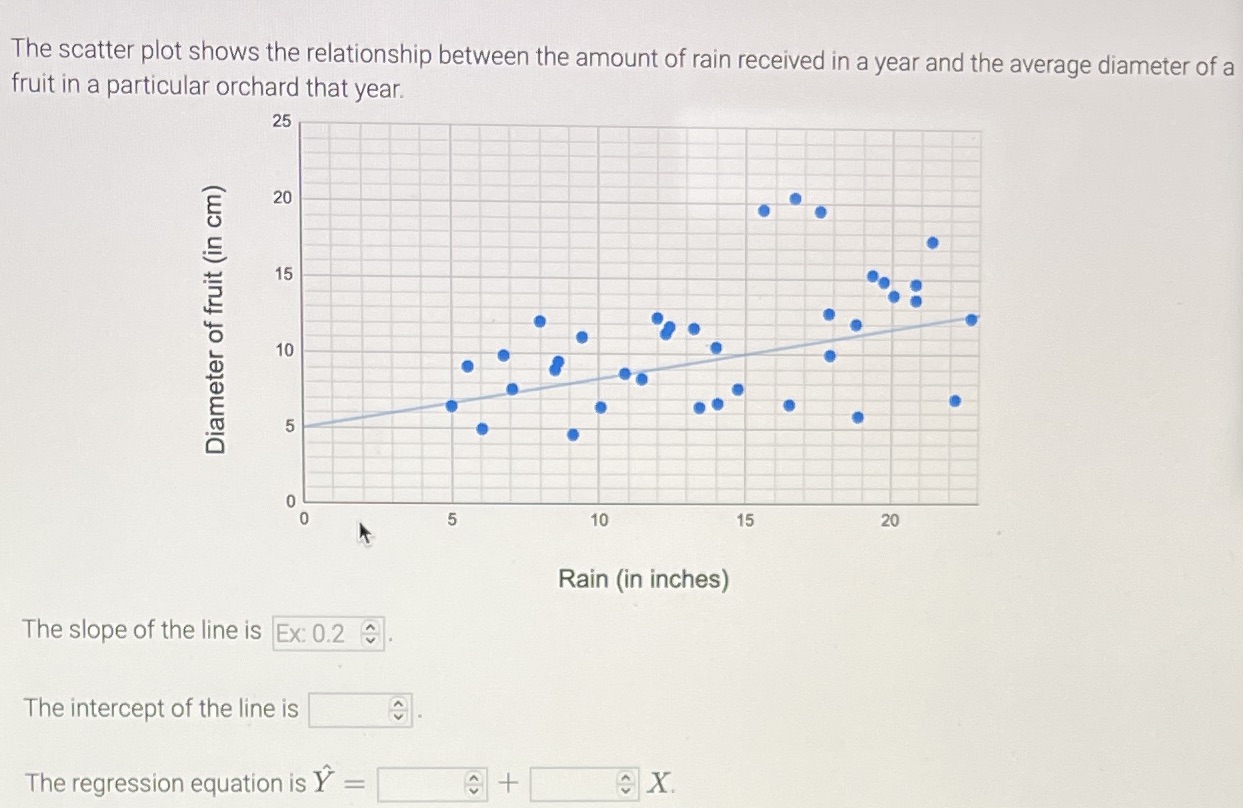
The scatter plot shows the relationship between the amount of rain received in a year and the average diameter of a fruit in a particular orchard that year. 25 20 15 Diameter of fruit (in cm) 10 5 0 5 10 15 20 Rain (in inches) The slope of the line is Ex: 0.2 The intercept of the line is The regression equation is Y =
Step by Step Solution
There are 3 Steps involved in it
1 Expert Approved Answer
Step: 1 Unlock

Question Has Been Solved by an Expert!
Get step-by-step solutions from verified subject matter experts
Step: 2 Unlock
Step: 3 Unlock