

Question: zy Section 3.1 - MAT 240: Applied S X G when is a linear model appropria x MAT- 240 : applied statistics - SN x
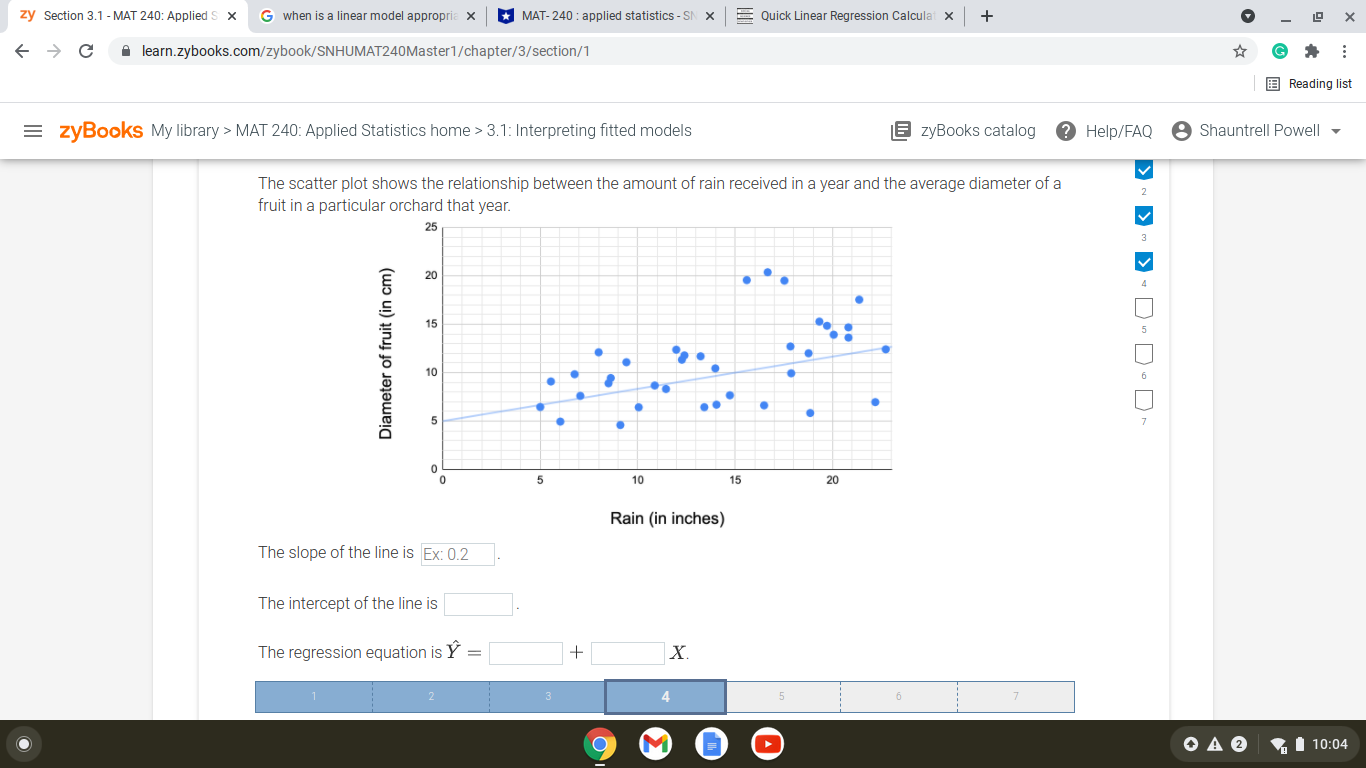
zy Section 3.1 - MAT 240: Applied S X G when is a linear model appropria x MAT- 240 : applied statistics - SN x Quick Linear Regression Calculat X + X -> C A learn.zybooks.com/zybook/SNHUMAT240Master1/chapter/3/section/1 G Reading list =zyBooks My library > MAT 240: Applied Statistics home > 3.1: Interpreting fitted models LE zyBooks catalog ? Help/FAQ Shauntrell Powell V The scatter plot shows the relationship between the amount of rain received in a year and the average diameter of a 2 fruit in a particular orchard that year. V 25 3 v 20 15 Diameter of fruit (in cm) 10 5 5 10 15 20 Rain (in inches) The slope of the line is Ex: 0.2 The intercept of the line is The regression equation is Y = + X. 2 3 4 5 6 7 M OA2 #10:04
Step by Step Solution
There are 3 Steps involved in it

Get step-by-step solutions from verified subject matter experts