

Question: The scatter plot shows the weight and fuel efficiency for each of 24 vehicles. Also shown is the line of best fit for the data.
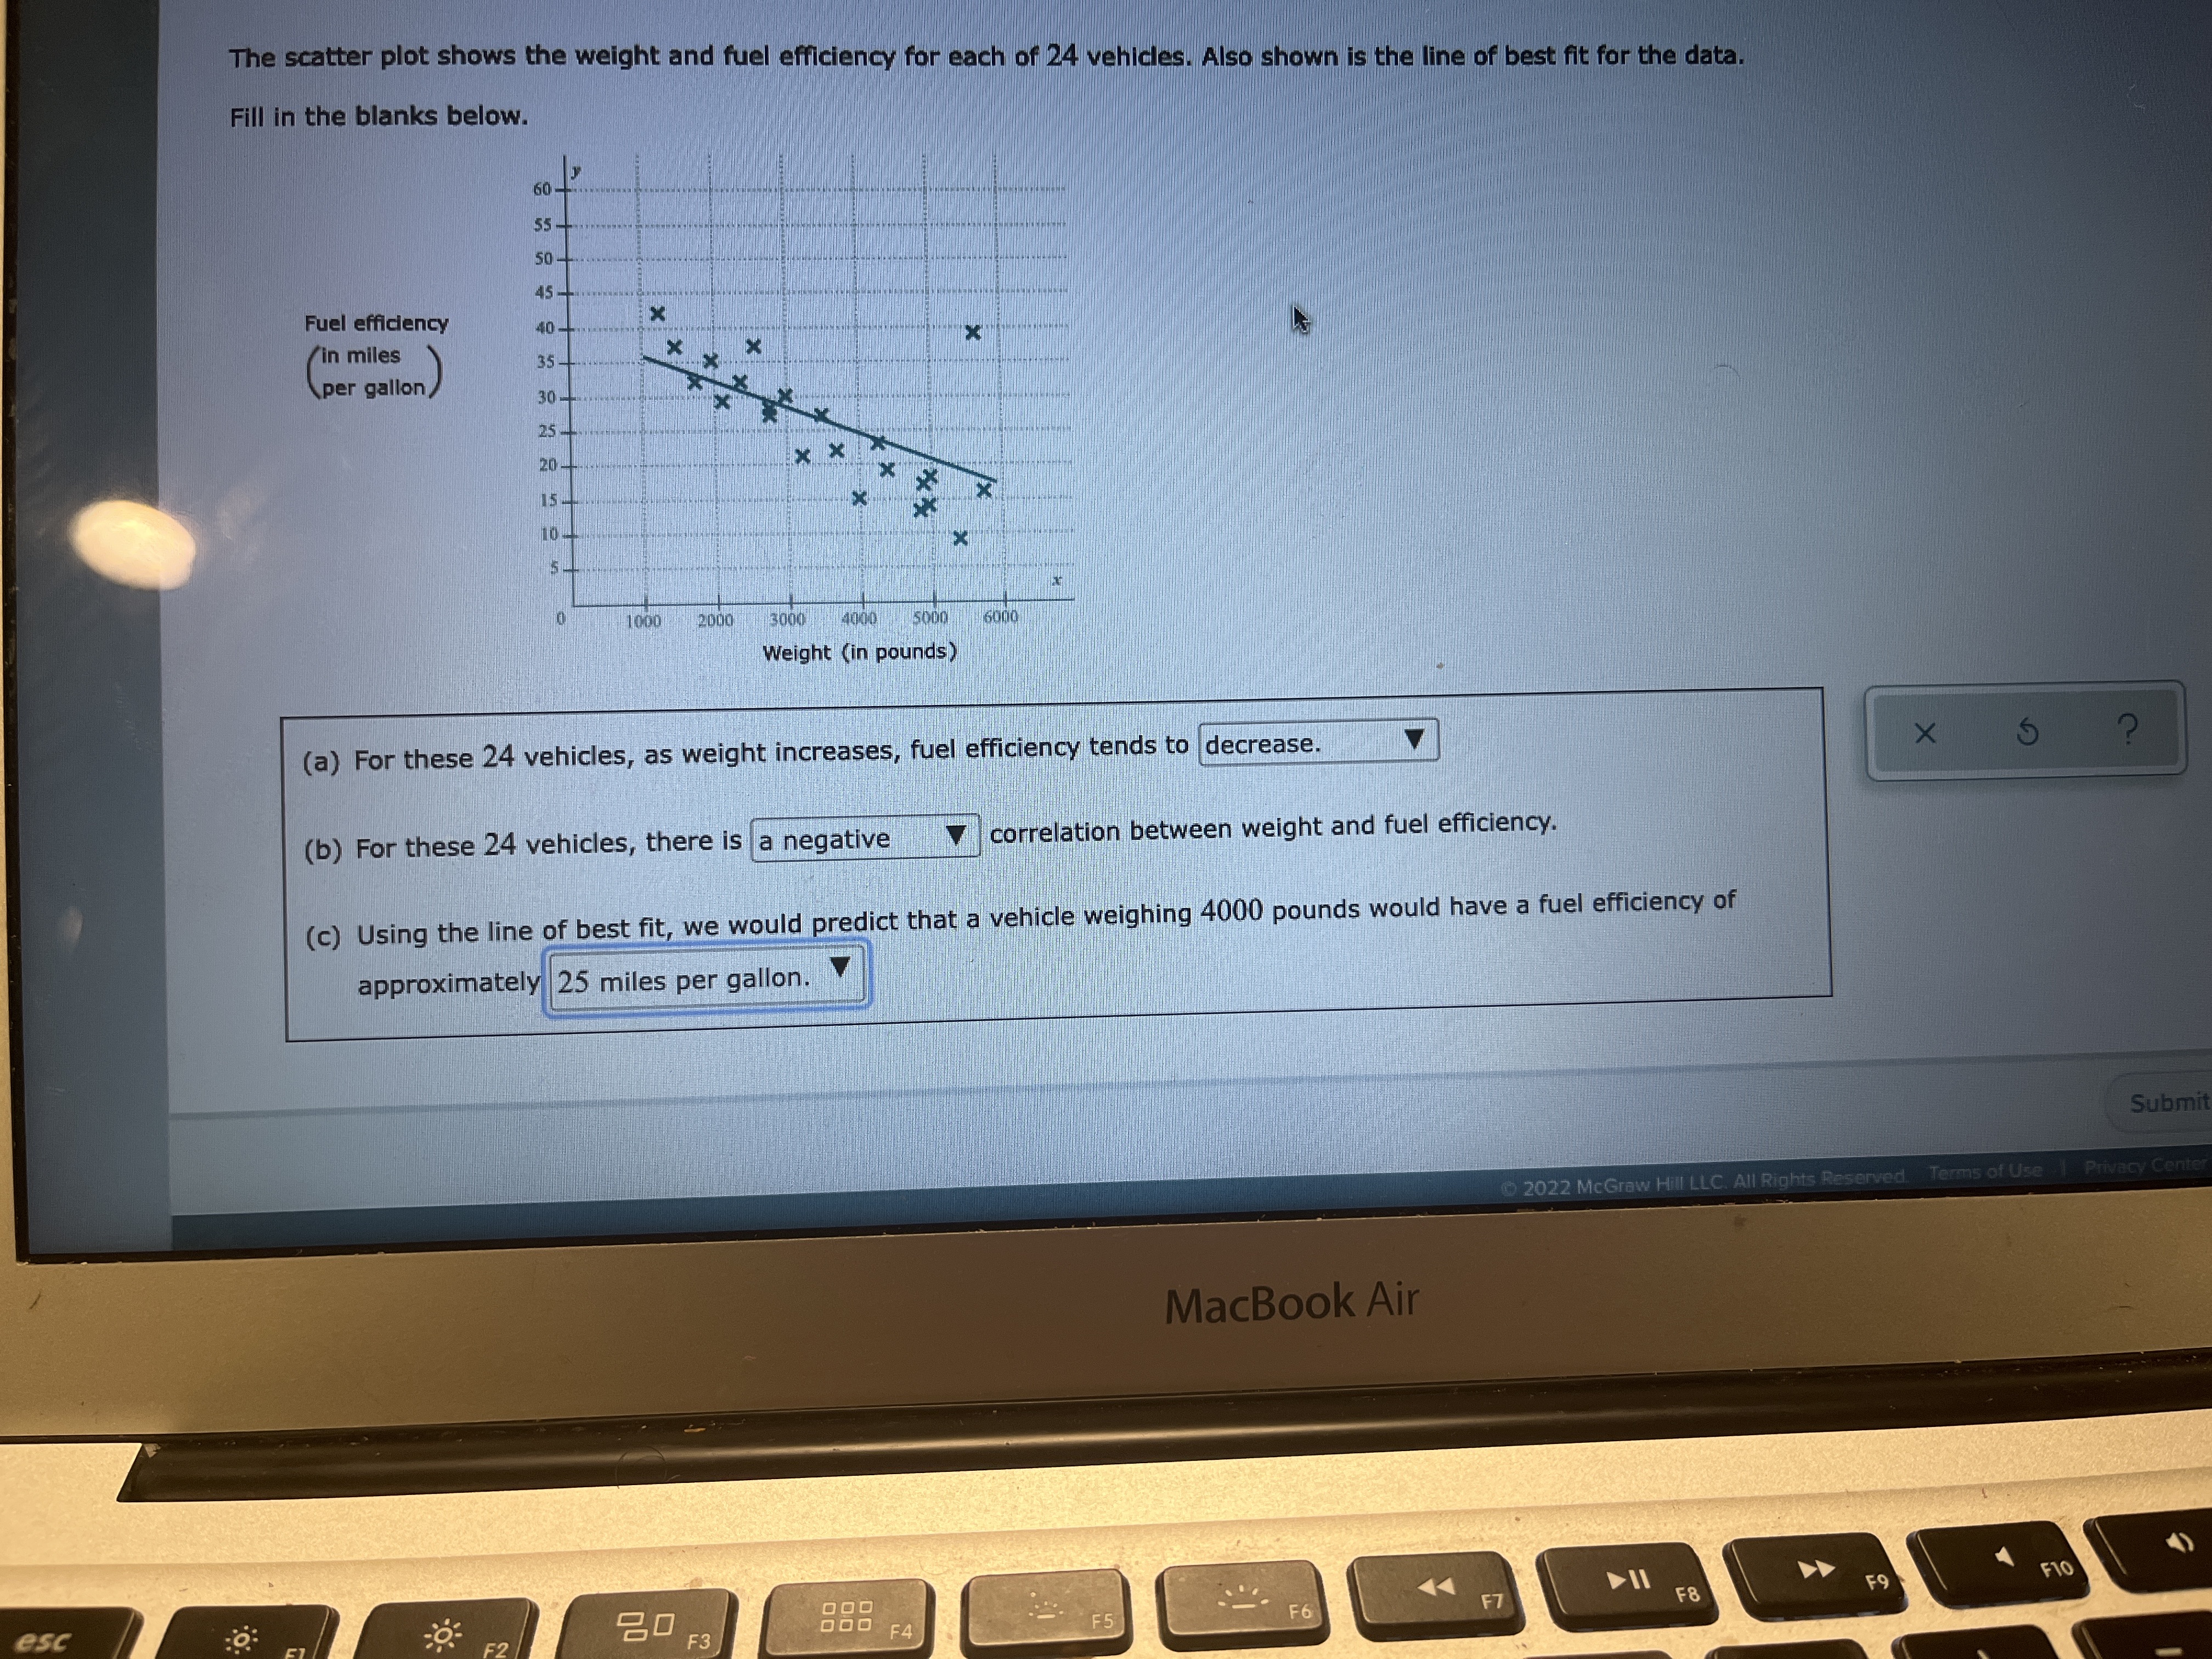
The scatter plot shows the weight and fuel efficiency for each of 24 vehicles. Also shown is the line of best fit for the data. Fill in the blanks below. 60 -" 55- Fuel efficiency in miles per gallon) 30 - 25 - 20 - 1000 2000 3000 4060 6080 Weight (in pounds) (a) For these 24 vehicles, as weight increases, fuel efficiency tends to decrease. X P (b) For these 24 vehicles, there is a negative correlation between weight and fuel efficiency. (c) Using the line of best fit, we would predict that a vehicle weighing 4000 pounds would have a fuel efficiency of approximately 25 miles per gallon. Submi 2022 McGraw Hill LLC. All Rights Terms of Use MacBook Air F9 F10 esc 20 F3 F4 F5 F6 F7 F8
Step by Step Solution
There are 3 Steps involved in it

Get step-by-step solutions from verified subject matter experts