

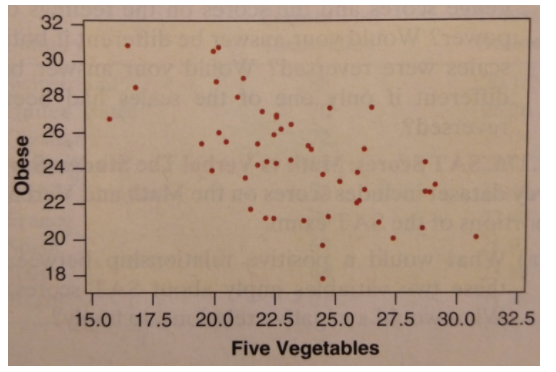
Question: The scatterplot below corresponds to a data set that analyzes the percent of the population of each state that eats at least five servings of
The scatterplot below corresponds to a data set that analyzes the percent of the population of each state that eats at least five servings of fruits and vegetables a day and the percent of the population of each state that is obese.
\f
Step by Step Solution
There are 3 Steps involved in it
1 Expert Approved Answer
Step: 1 Unlock

Question Has Been Solved by an Expert!
Get step-by-step solutions from verified subject matter experts
Step: 2 Unlock
Step: 3 Unlock