

Question: The scatterplot below shows data on railroad passenger injuries (number of persons per year) and train-miles, which are in millions of miles traveled. Which of
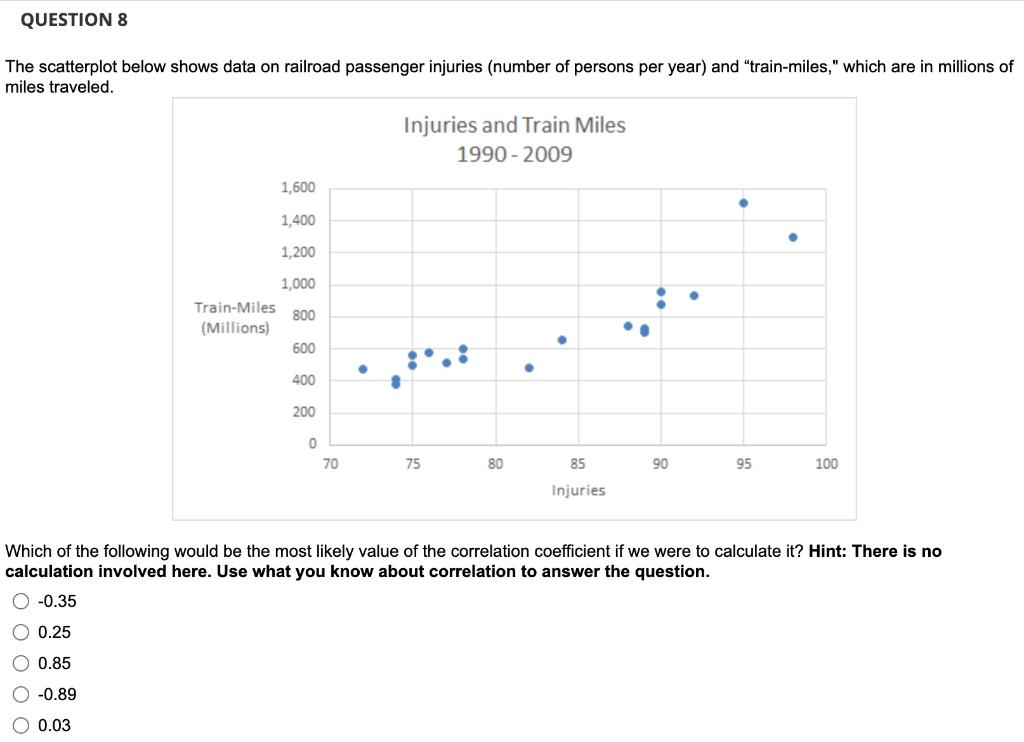
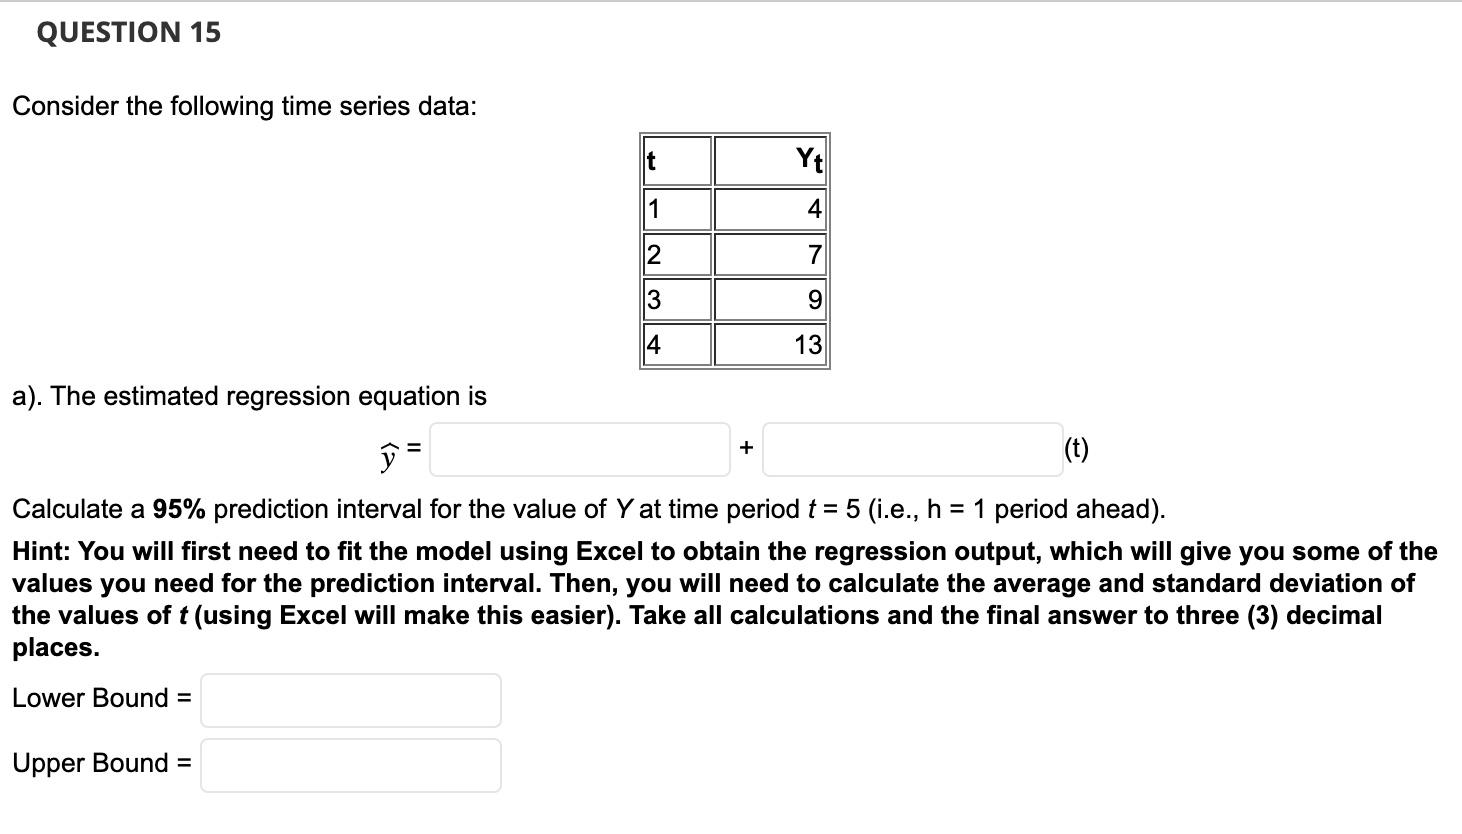
The scatterplot below shows data on railroad passenger injuries (number of persons per year) and "train-miles," which are in millions of miles traveled. Which of the following would be the most likely value of the correlation coefficient if we were to calculate it? Hint: There is no calculation involved here. Use what you know about correlation to answer the question. 0.35 0.25 0.85 0.89 0.03 Consider the following time series data: a). The estimated regression equation is y= Calculate a 95% prediction interval for the value of Y at time period t=5 (i.e., h=1 period ahead). Hint: You will first need to fit the model using Excel to obtain the regression output, which will give you some of the values you need for the prediction interval. Then, you will need to calculate the average and standard deviation of the values of t (using Excel will make this easier). Take all calculations and the final answer to three (3) decimal places. Lower Bound = Upper Bound = The scatterplot below shows data on railroad passenger injuries (number of persons per year) and "train-miles," which are in millions of miles traveled. Which of the following would be the most likely value of the correlation coefficient if we were to calculate it? Hint: There is no calculation involved here. Use what you know about correlation to answer the question. 0.35 0.25 0.85 0.89 0.03 Consider the following time series data: a). The estimated regression equation is y= Calculate a 95% prediction interval for the value of Y at time period t=5 (i.e., h=1 period ahead). Hint: You will first need to fit the model using Excel to obtain the regression output, which will give you some of the values you need for the prediction interval. Then, you will need to calculate the average and standard deviation of the values of t (using Excel will make this easier). Take all calculations and the final answer to three (3) decimal places. Lower Bound = Upper Bound =
Step by Step Solution
There are 3 Steps involved in it

Get step-by-step solutions from verified subject matter experts