

Question: The scatterplot below shows Olympic gold medal performances in the long jump from 1900 to 1988. The long ju is measured in meters. 9.0- 8.8
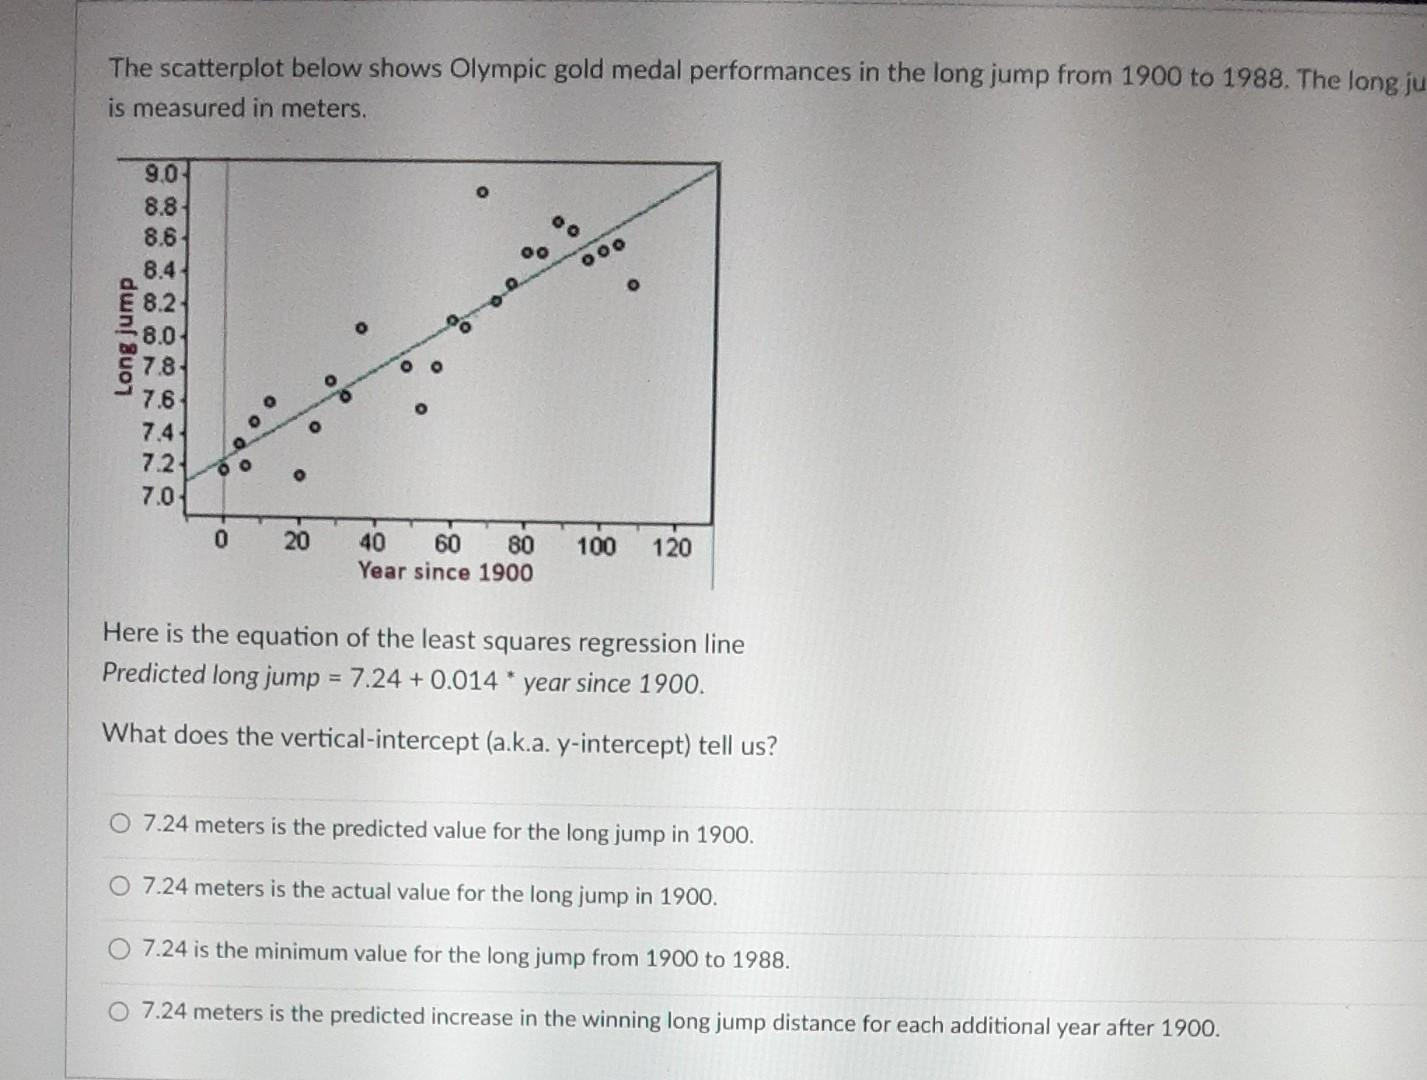
The scatterplot below shows Olympic gold medal performances in the long jump from 1900 to 1988. The long ju is measured in meters. 9.0- 8.8 8.6 8.4 8.2 Long jump :8.0 78 7.6 7.4 7.2 7.0 20 40 60 80 100 120 Year since 1900 Here is the equation of the least squares regression line Predicted long jump = 7.24 + 0.014 * year since 1900. What does the vertical-intercept (a.k.a. y-intercept) tell us? O 7.24 meters is the predicted value for the long jump in 1900. O 7.24 meters is the actual value for the long jump in 1900. 7.24 is the minimum value for the long jump from 1900 to 1988. 7.24 meters is the predicted increase in the winning long jump distance for each additional year after 1900
Step by Step Solution
There are 3 Steps involved in it

Get step-by-step solutions from verified subject matter experts