

Question: The scatterplot below shows Olympic gold medal performances in the long jump and the high jump from 1900 to 1988. Each point shows the
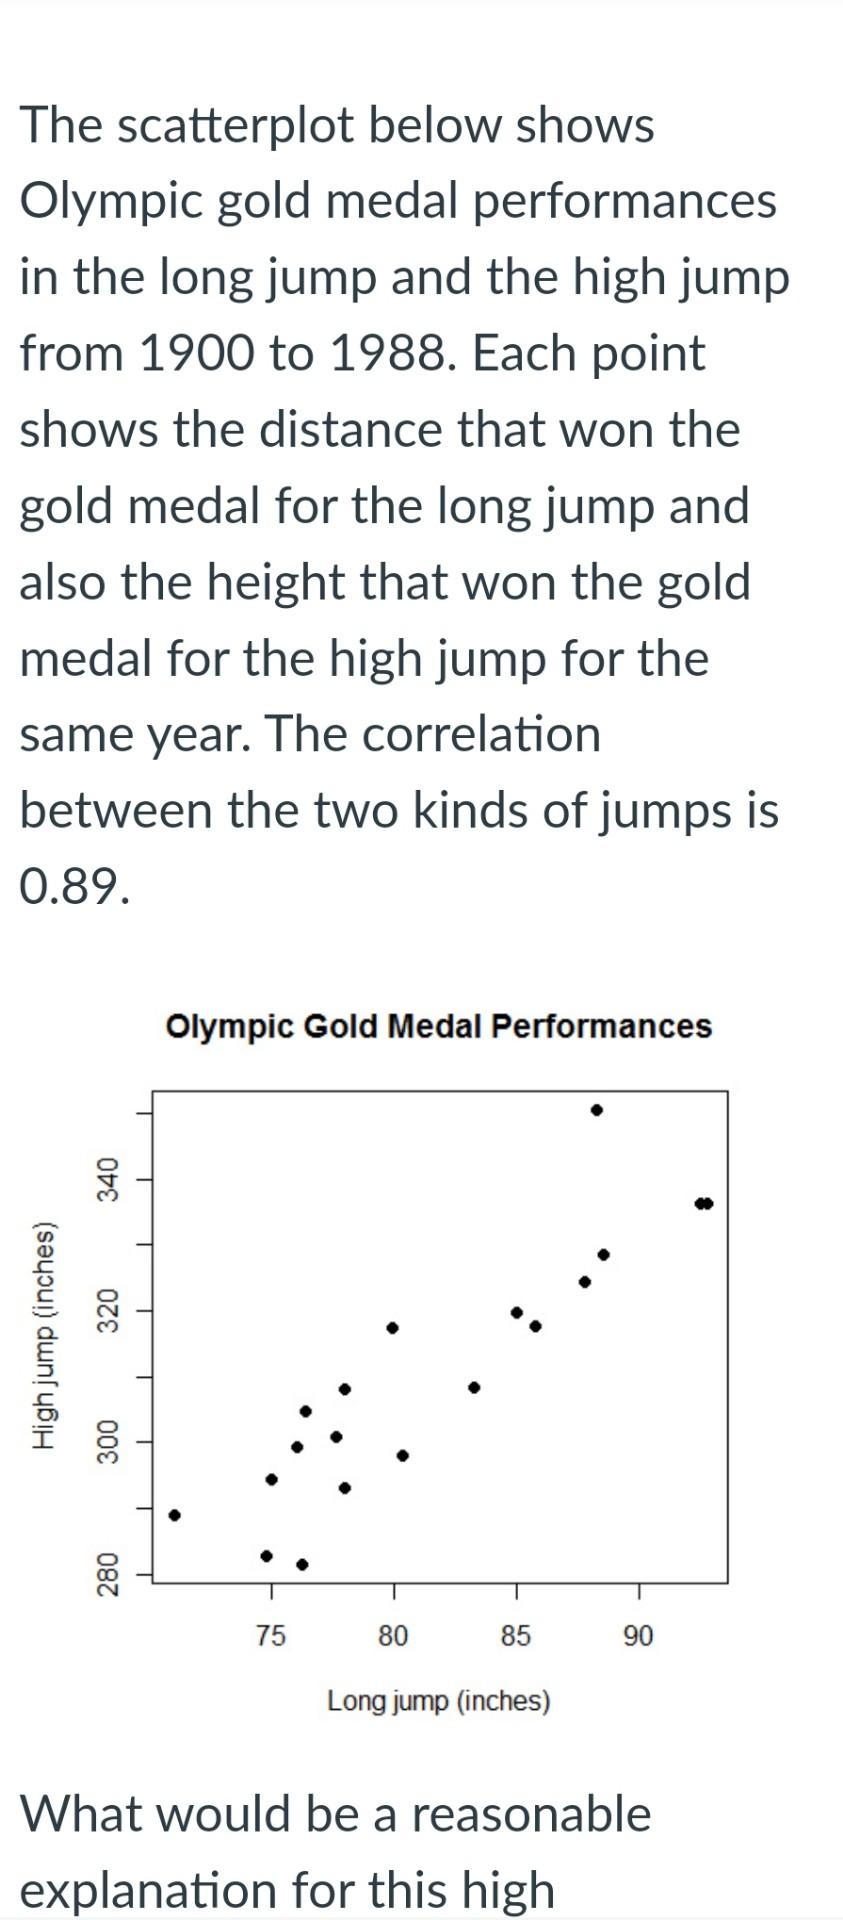
The scatterplot below shows Olympic gold medal performances in the long jump and the high jump from 1900 to 1988. Each point shows the distance that won the gold medal for the long jump and also the height that won the gold medal for the high jump for the same year. The correlation between the two kinds of jumps is 0.89. 340 High jump (inches) 300 320 280 Olympic Gold Medal Performances 75 80 85 Long jump (inches) 90 What would be a reasonable explanation for this high
Step by Step Solution
3.33 Rating (147 Votes )
There are 3 Steps involved in it
Solution General Guidance The answer provided below has been developed in ... View full answer

Get step-by-step solutions from verified subject matter experts