

Question: The scatterplot below shows the number of soft drinks sold, in thousands of gallons, by fast food restaurants over a 15-year period. Soft Drinks
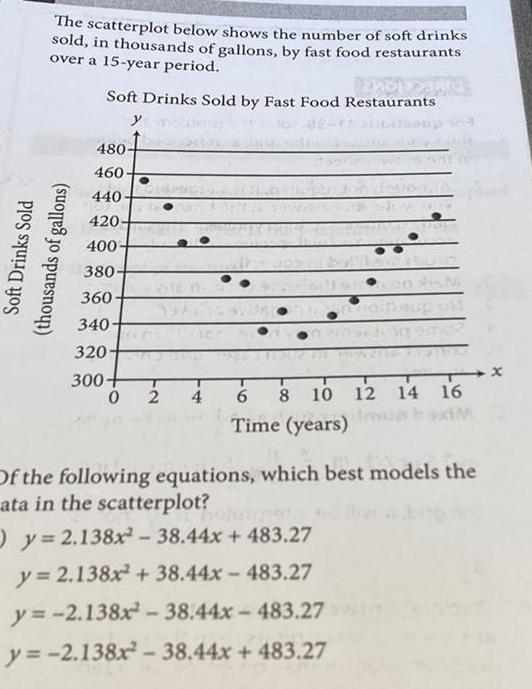
The scatterplot below shows the number of soft drinks sold, in thousands of gallons, by fast food restaurants over a 15-year period. Soft Drinks Sold by Fast Food Restaurants Soft Drinks Sold (thousands of gallons) y 480- 460 440- 420- 400- 380 360 340- 320 300+ T T T 0 2 4 6 8 10 12 14 1x 16 fres Time (years) Of the following equations, which best models the ata in the scatterplot? O y=2.138x2-38.44x + 483.27 y=2.138x+38.44x-483.27 y=-2.138x2-38.44x-483.27 y=-2.138x2-38.44x + 483.27
Step by Step Solution
There are 3 Steps involved in it
1 Expert Approved Answer
Step: 1 Unlock

Question Has Been Solved by an Expert!
Get step-by-step solutions from verified subject matter experts
Step: 2 Unlock
Step: 3 Unlock