

Question: The scatterplot contains data points, showing the Using the least-squares regression method, which is number of hours a coffee shop is open (x) and the
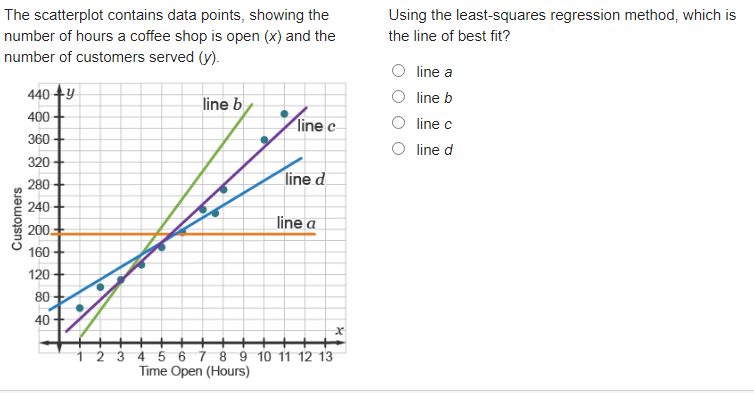
The scatterplot contains data points, showing the Using the least-squares regression method, which is number of hours a coffee shop is open (x) and the the line of best fit? number of customers served (y). O line a 440 +y line b O line b 400 line c O line c 360 O line d 320 280 line d 240 Customers 200 line a 160 120 80 40 X 3 4 5 6 7 8 9 10 11 12 13 Time Open (Hours)
Step by Step Solution
There are 3 Steps involved in it
1 Expert Approved Answer
Step: 1 Unlock

Question Has Been Solved by an Expert!
Get step-by-step solutions from verified subject matter experts
Step: 2 Unlock
Step: 3 Unlock