

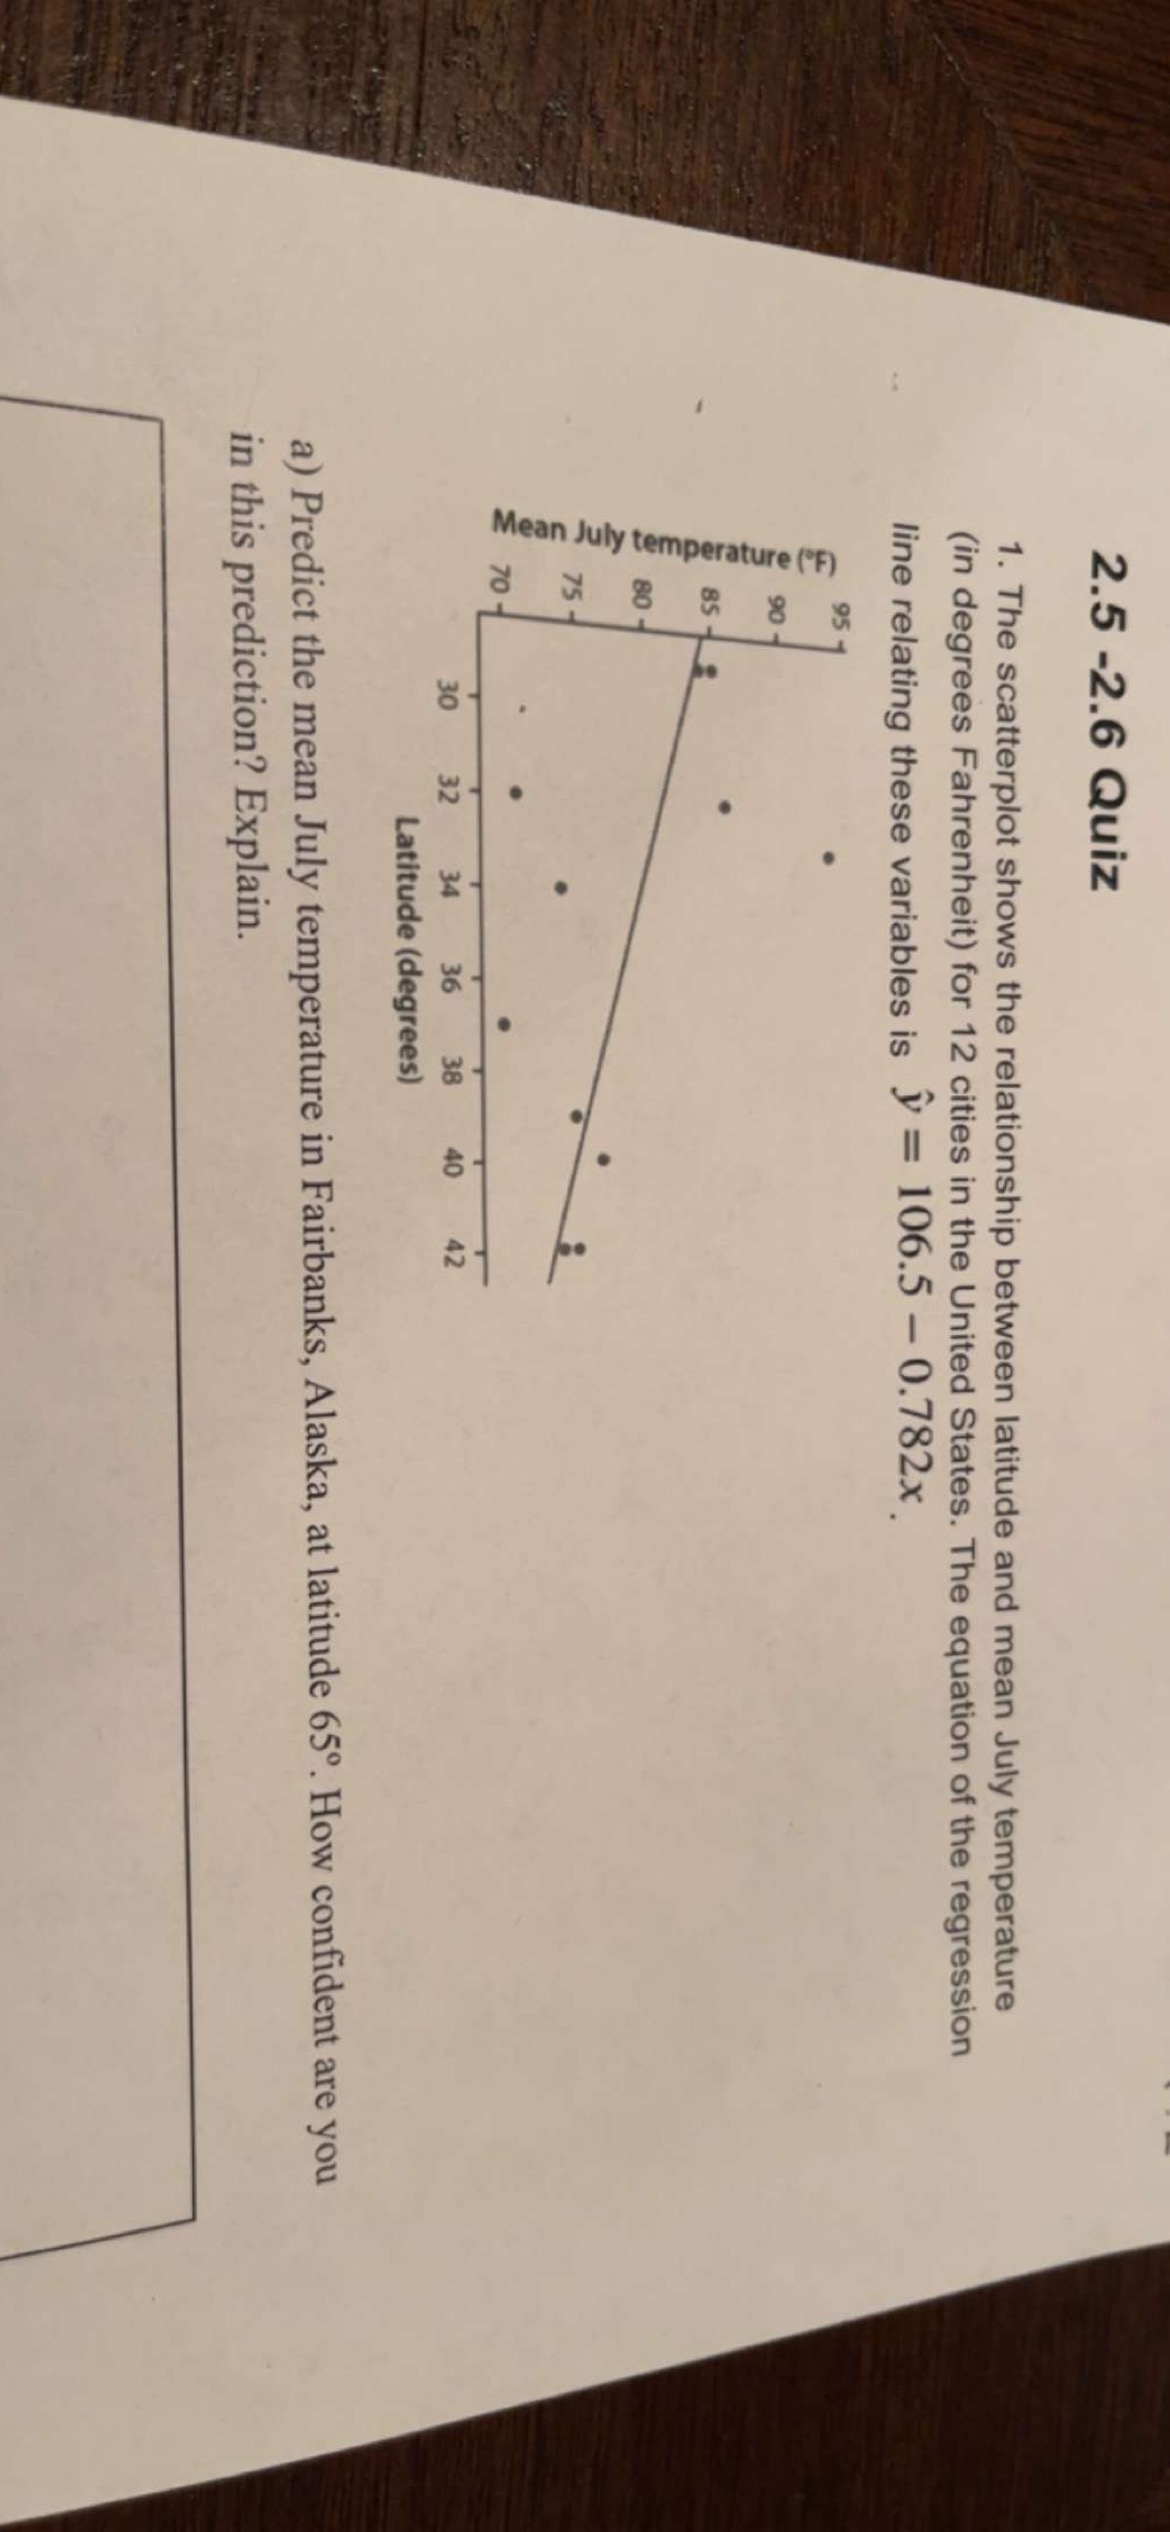
Question: The scatterplot shows the relationship between latitude and mean July temperature (In degrees Fahrenheit) for 12 cities in the United States. The equation of the
The scatterplot shows the relationship between latitude and mean July temperature (In degrees Fahrenheit) for 12 cities in the United States. The equation of the regression line relating these variables is = 106.5 - 0.782x.
Step by Step Solution
There are 3 Steps involved in it
1 Expert Approved Answer
Step: 1 Unlock

Question Has Been Solved by an Expert!
Get step-by-step solutions from verified subject matter experts
Step: 2 Unlock
Step: 3 Unlock