

Question: The score distribution shown in the table is for all students who took a yearly AP statistics exam. Score Percent of students Complete parts a)
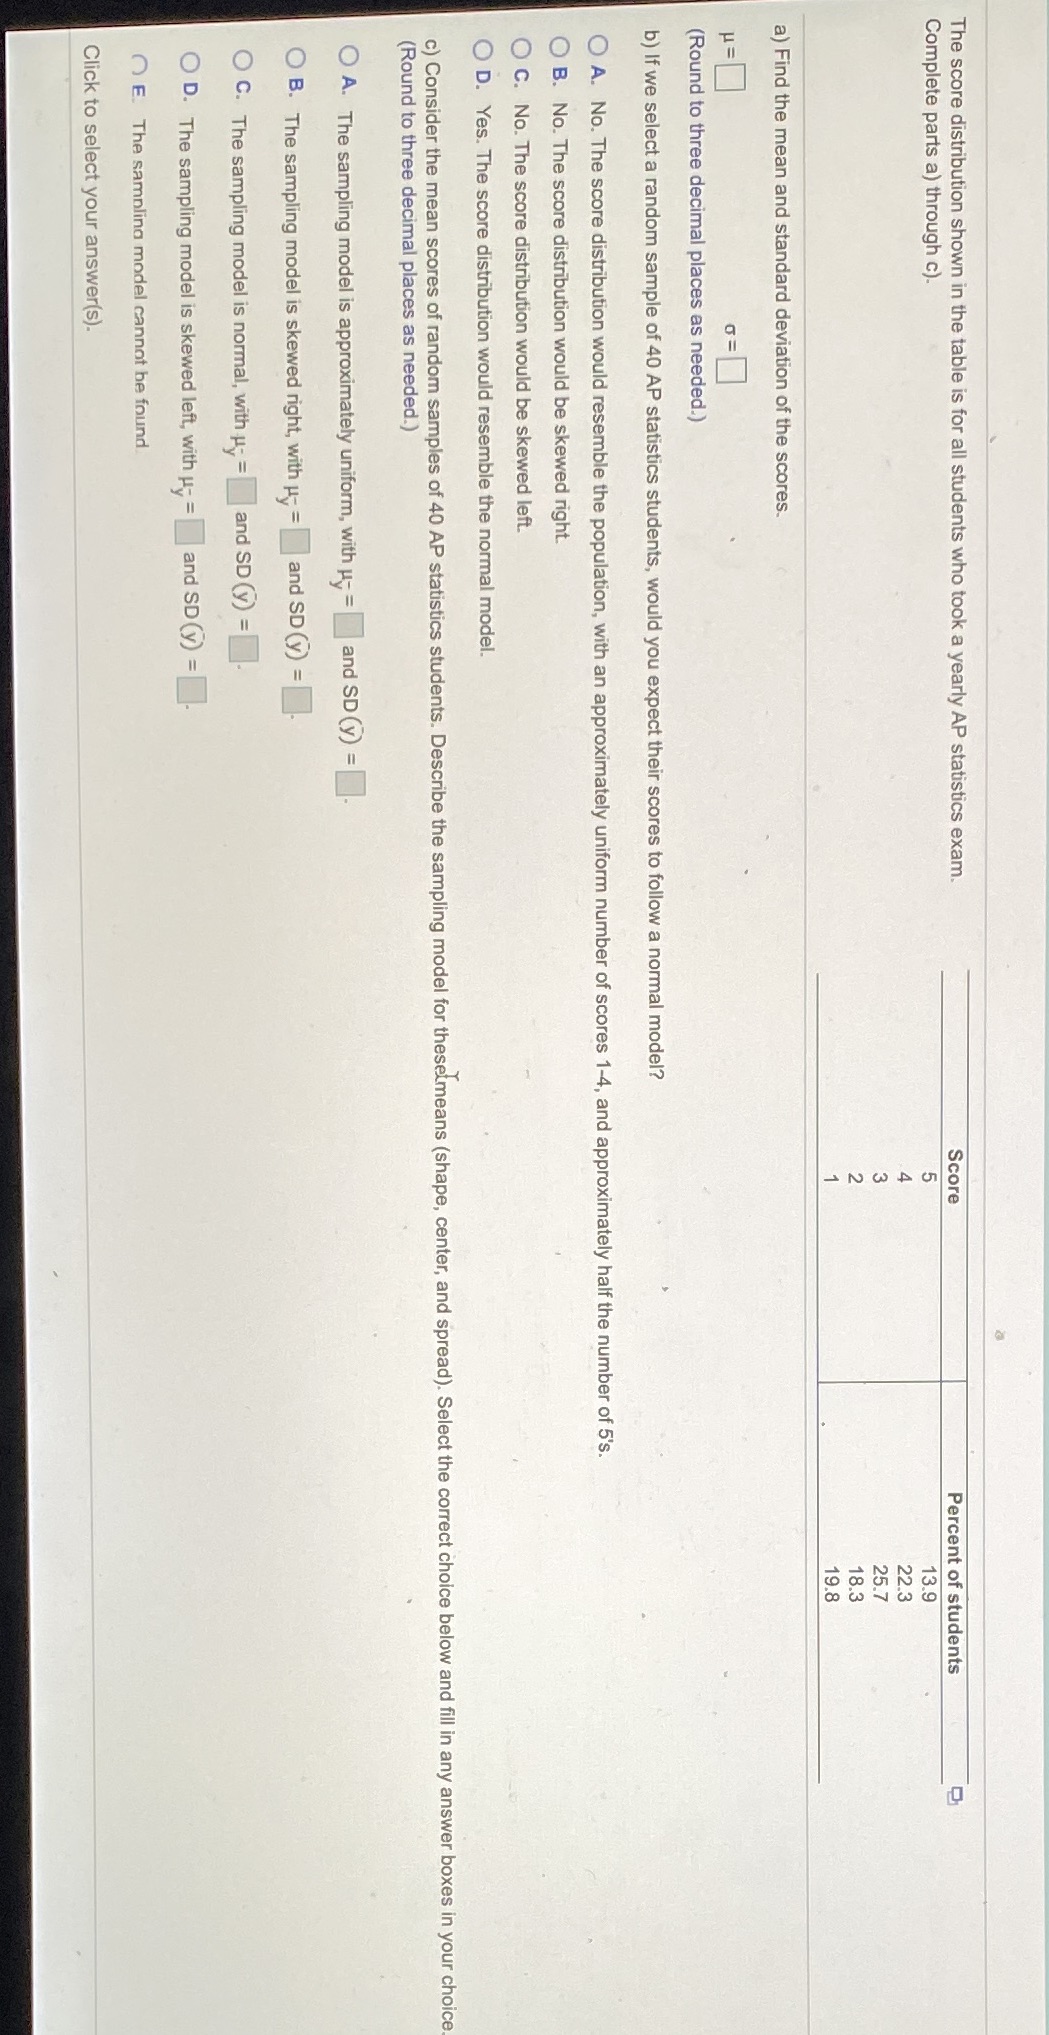
The score distribution shown in the table is for all students who took a yearly AP statistics exam. Score Percent of students Complete parts a) through c). 13.9 22.3 25.7 18.3 19.8 a) Find the mean and standard deviation of the scores. H= (Round to three decimal places as needed.) b) If we select a random sample of 40 AP statistics students, would you expect their scores to follow a normal model? O A. No. The score distribution would resemble the population, with an approximately uniform number of scores 1-4, and approximately half the number of 5's. O B. No. The score distribution would be skewed right. O C. No. The score distribution would be skewed left. O D. Yes. The score distribution would resemble the normal model. c) Consider the mean scores of random samples of 40 AP statistics students. Describe the sampling model for thesetmeans (shape, center, and spread). Select the correct choice below and fill in any answer boxes in your choice (Round to three decimal places as needed.) O A. The sampling model is approximately uniform, with - = and SD (y) = O B. The sampling model is skewed right, with Hy = and SD (y) = O C. The sampling model is normal, with ; = and SD (y) =. O D. The sampling model is skewed left, with u- = and SD(y) =. () E. The sampling model cannot be found Click to select your answer(s)
Step by Step Solution
There are 3 Steps involved in it

Get step-by-step solutions from verified subject matter experts