

Question: The scores on a standardized test for a certain year are modeled using the normal distribution shown below. The mean of the distribution is 72.7
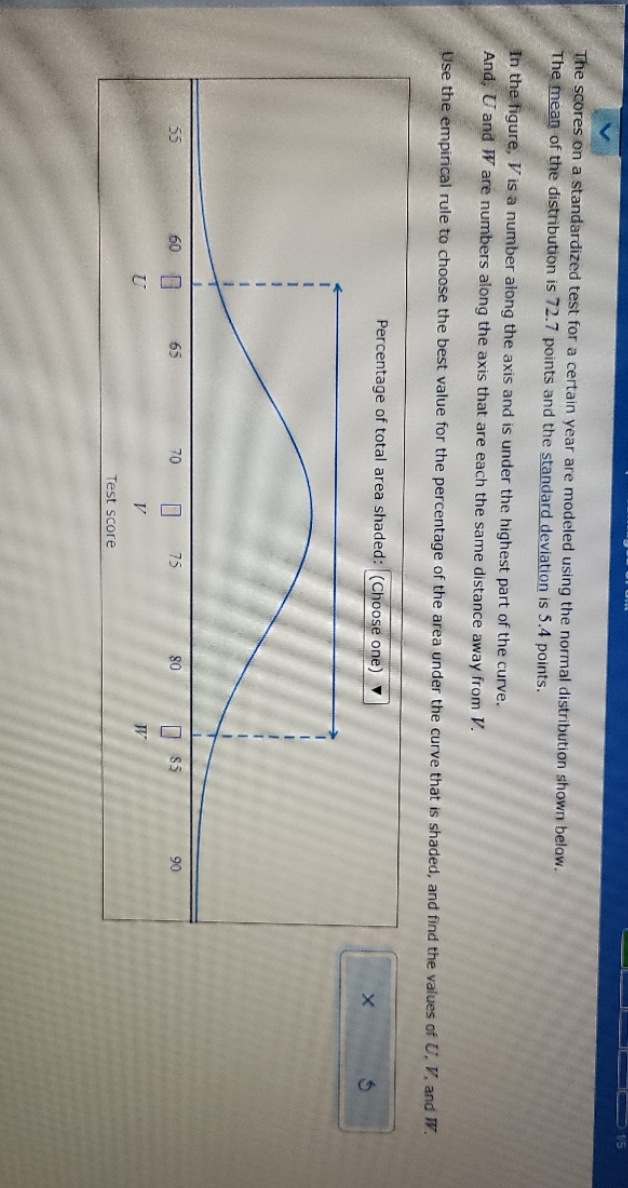

The scores on a standardized test for a certain year are modeled using the normal distribution shown below. The mean of the distribution is 72.7 points and the standard deviation is 5.4 points. In the figure, I' is a number along the axis and is under the highest part of the curve. And, U and I are numbers along the axis that are each the same distance away from V. Use the empirical rule to choose the best value for the percentage of the area under the curve that is shaded, and find the values of U, V. and W. Percentage of total area shaded: (Choose one) X DE Test score
Step by Step Solution
There are 3 Steps involved in it
1 Expert Approved Answer
Step: 1 Unlock

Question Has Been Solved by an Expert!
Get step-by-step solutions from verified subject matter experts
Step: 2 Unlock
Step: 3 Unlock