

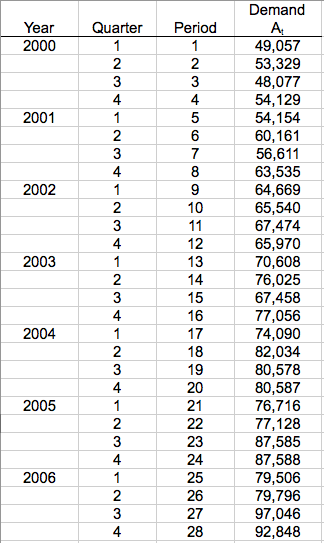
Question: The screenshot Excel file (Forecasting Assignment Data) contains quarterly Food shipments for Kraft Foods, Inc from 2000 through 2006. Forecast Kraft Foods quarterly food shipments
The screenshot Excel file (Forecasting Assignment Data) contains quarterly Food shipments for Kraft Foods, Inc from 2000 through 2006. Forecast Kraft Foods quarterly food shipments for 2007 using:
1) Quadratic Trend with Seasonal Indices Model
Show excel work with equations on how to solve it
Step by Step Solution
There are 3 Steps involved in it
1 Expert Approved Answer
Step: 1 Unlock

Question Has Been Solved by an Expert!
Get step-by-step solutions from verified subject matter experts
Step: 2 Unlock
Step: 3 Unlock