

Question: The second image is the Date for Q8. 1. Define the following with your own understanding: quality, specifications, tolerances, inspection, and prevention. (20 pts) 2.
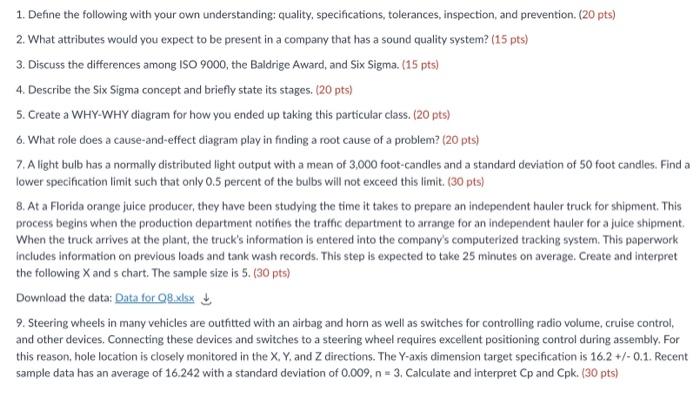
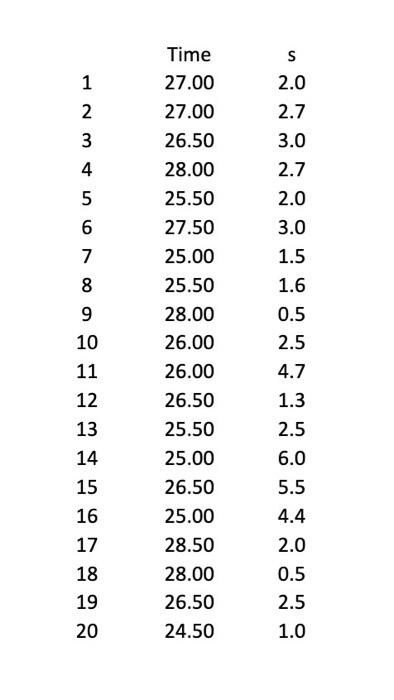
1. Define the following with your own understanding: quality, specifications, tolerances, inspection, and prevention. (20 pts) 2. What attributes would you expect to be present in a company that has a sound quality system? (15 pts) 3. Discuss the differences among ISO 9000, the Baldrige Award, and Six Sigma. (15 pts) 4. Describe the Six Sigma concept and briefly state its stages. (20 pts) 5. Create a WHY-WHY diagram for how you ended up taking this particular class. (20 pts) 6. What role does a cause-and-effect diagram play in finding a root cause of a problem? (20 pts) 7. A light bulb has a normally distributed light output with a mean of 3,000 foot-candles and a standard deviation of 50 foot candles. Find a lower specification limit such that only 0.5 percent of the bulbs will not exceed this limit. (30 pts) 8. At a Florida orange juice producer, they have been studying the time it takes to prepare an independent hauler truck for shipment. This process begins when the production department notifies the traffic department to arrange for an independent hauler for a juice shipment. When the truck arrives at the plant, the truck's information is entered into the company's computerized tracking system. This paperwork includes information on previous loads and tank wash records. This step is expected to take 25 minutes on average. Create and interpret the following X and s chart. The sample size is 5. (30 pts) Download the data: Data for Q8.xlsx 9. Steering wheels in many vehicles are outfitted with an airbag and horn as well as switches for controlling radio volume, cruise control, and other devices. Connecting these devices and switches to a steering wheel requires excellent positioning control during assembly. For this reason, hole location is closely monitored in the X, Y. and Z directions. The Y-axis dimension target specification is 16.2 +/-0.1. Recent sample data has an average of 16.242 with a standard deviation of 0.009, n = 3, Calculate and interpret Cp and Cpk. (30 pts) 1 2 34567 8 9 10 11 12 13 14 15 16 17 18 19 20 Time 27.00 27.00 26.50 28.00 25.50 27.50 25.00 25.50 28.00 26.00 26.00 26.50 25.50 25.00 26.50 25.00 28.50 28.00 26.50 24.50 S 2.0 2.7 3.0 2.7 2.0 3.0 1.5 1.6 0.5 2.5 4.7 1.3 2.5 6.0 5.5 4.4 2.0 0.5 2.5 1.0
Step by Step Solution
There are 3 Steps involved in it

Get step-by-step solutions from verified subject matter experts