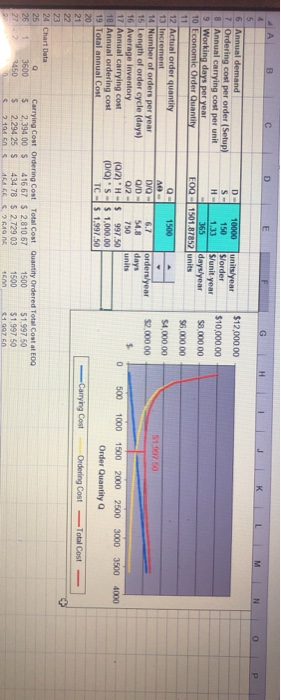
Question: the second one is the EOQ to get the top answers I just am not sure the numbers to input in blue on the first

the second one is the EOQ to get the top answers I just am not sure the numbers to input in blue on the first document the second one is the EOQ to get the top answers
the second one is the EOQ to get the top answers
D F 1 Reorder Point (ROP) with EOQ Ordering H R 5 3 Reorder Point LA Probability 5 6 Average daily demand units 7 Average lead time days 8 Std dev demand during lead time units 9 Service level SL 10 Increment ASL 11 Stock out risk 1. 12 z associated with service level NUM: 13 Average demand during lead time di 0 units 14 Safety stock SS #NUM! units 15 Reorder point ROP INUM! units 16 0.0 17 18 19 20 21 22 23 24 Chart Data cumulative daily probability demand probability demand mass ROP Instructions Basic ECO Reorder Point No Safety Stock 02 08 1.0 04 0.6 Daliy Demand -dally demand ROP Reorder Point With Safety Stock + H N P S/unit year 4. B G 4 5 6 Annual demand D 10000 units/year $12,000.00 7 Ordering cost per order (Setup) S 150 Slorder 8 Annual carrying cost per unit $10,000.00 1.33 9 Working days per year 365 days/year $8.000.00 10 Economic Order Quantity FOO 1501.87852 units 11 $6,000.00 12 Actual order quantity Q 1500 $4,000.00 13 Increment M 14 Number of orders per year D/Q 6.7 orders/year $2,000 00 15 Length of order cycle (days) C/D 54.8 [days 16 Average Inventory Q/2 750 units $ 17 Annual carrying cost (0/2) $ 0 997.50 18 Annual ordering cost (0/0) S - $ 1,000.00 19 Total annual Cost TC-IS 1997.50 20 21 22 23 24 Chart Data 25 0 Carrying Cost Ordering Cost Total Cost Quantity Ordered Total Cost at EDO 26 1 3600 5 2,394 00 416.67 $ 2.810 67 1500 $1,997 50 27 3450 $ 2.294 25$ 434.78 5 2.729 03 1500 $1,997 50 214450 164 269 NE 1997.50 500 1000 4000 1500 2000 2500 3000 3500 Order Quantity Carrying Cost Ordering Cost Total Cost D F 1 Reorder Point (ROP) with EOQ Ordering H R 5 3 Reorder Point LA Probability 5 6 Average daily demand units 7 Average lead time days 8 Std dev demand during lead time units 9 Service level SL 10 Increment ASL 11 Stock out risk 1. 12 z associated with service level NUM: 13 Average demand during lead time di 0 units 14 Safety stock SS #NUM! units 15 Reorder point ROP INUM! units 16 0.0 17 18 19 20 21 22 23 24 Chart Data cumulative daily probability demand probability demand mass ROP Instructions Basic ECO Reorder Point No Safety Stock 02 08 1.0 04 0.6 Daliy Demand -dally demand ROP Reorder Point With Safety Stock + H N P S/unit year 4. B G 4 5 6 Annual demand D 10000 units/year $12,000.00 7 Ordering cost per order (Setup) S 150 Slorder 8 Annual carrying cost per unit $10,000.00 1.33 9 Working days per year 365 days/year $8.000.00 10 Economic Order Quantity FOO 1501.87852 units 11 $6,000.00 12 Actual order quantity Q 1500 $4,000.00 13 Increment M 14 Number of orders per year D/Q 6.7 orders/year $2,000 00 15 Length of order cycle (days) C/D 54.8 [days 16 Average Inventory Q/2 750 units $ 17 Annual carrying cost (0/2) $ 0 997.50 18 Annual ordering cost (0/0) S - $ 1,000.00 19 Total annual Cost TC-IS 1997.50 20 21 22 23 24 Chart Data 25 0 Carrying Cost Ordering Cost Total Cost Quantity Ordered Total Cost at EDO 26 1 3600 5 2,394 00 416.67 $ 2.810 67 1500 $1,997 50 27 3450 $ 2.294 25$ 434.78 5 2.729 03 1500 $1,997 50 214450 164 269 NE 1997.50 500 1000 4000 1500 2000 2500 3000 3500 Order Quantity Carrying Cost Ordering Cost Total Cost

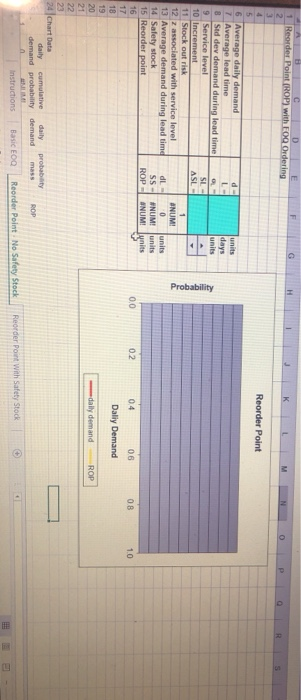
Step by Step Solution

There are 3 Steps involved in it

1 Expert Approved Answer
Step: 1 Unlock blur-text-image
Question Has Been Solved by an Expert!

Get step-by-step solutions from verified subject matter experts

Step: 2 Unlock
Step: 3 Unlock

Students Have Also Explored These Related General Management Questions!