

Question: The side by side bar praphs below are based on the same data set. (Both use the same array to generate the graphs) The data
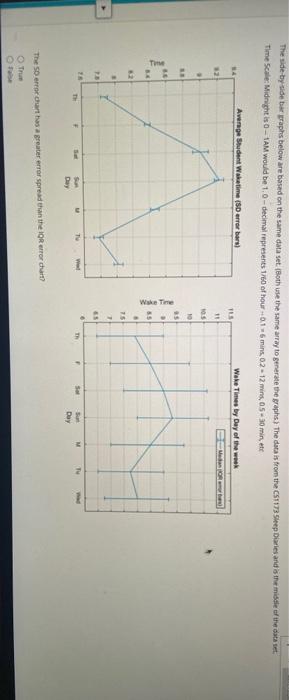
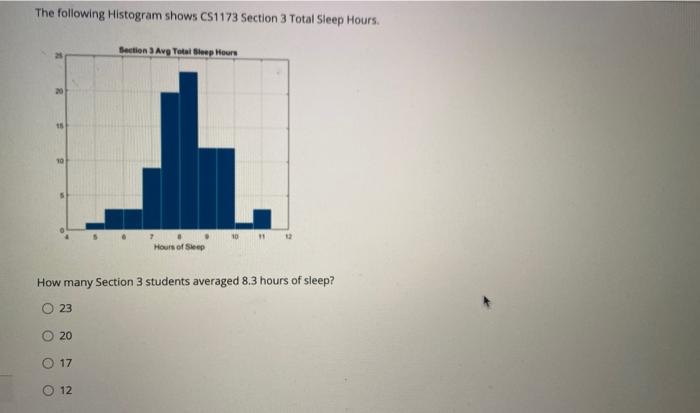
The side by side bar praphs below are based on the same data set. (Both use the same array to generate the graphs) The data is from the C51173 Sep Diaries and is the middle of the dataset Time Scale Midnight is 0-1AM would be 1.0-decimal represents 1/60 of hour 0,16 mins. 02 - 12 mins. 05-30 min, et Average Student Wakatime (SD error bars) 14 Wake Times by Day of the week TUS 10 OS 10 TI Wiskie 55 75 TU TH F W TH F M Ty 5 P Day The Serrurt has a greater error spread than the OR error chart True The following Histogram shows CS1173 Section 3 Total Sleep Hours. Bection 3 Avg Totni Sloep Hours Hours of Sep How many Section 3 students averaged 8.3 hours of sleep? 23 20 17 12
Step by Step Solution
There are 3 Steps involved in it

Get step-by-step solutions from verified subject matter experts