

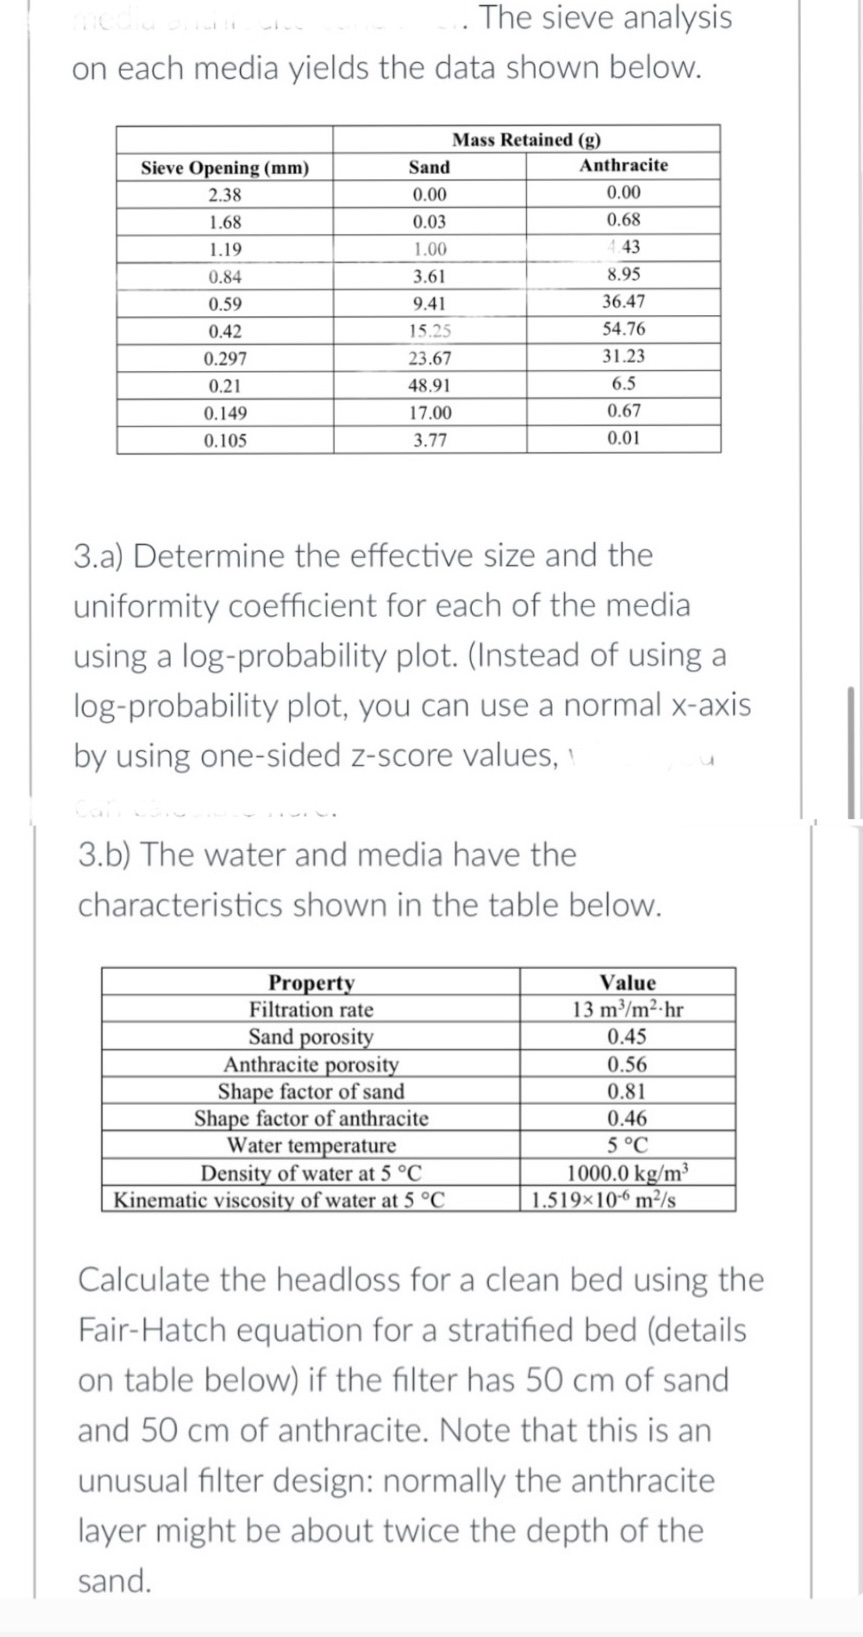
Question: The sieve analysis on each media yields the data shown below. 3 . a ) Determine the effective size and the uniformity coefficient for each
The sieve analysis
on each media yields the data shown below.
a Determine the effective size and the
uniformity coefficient for each of the media
using a logprobability plot. Instead of using a
logprobability plot, you can use a normal xaxis
by using onesided zscore values,
b The water and media have the
characteristics shown in the table below.
Calculate the headloss for a clean bed using the
FairHatch equation for a stratified bed details
on table below if the filter has of sand
and of anthracite. Note that this is an
unusual filter design: normally the anthracite
layer might be about twice the depth of the
sand.
Step by Step Solution
There are 3 Steps involved in it
1 Expert Approved Answer
Step: 1 Unlock

Question Has Been Solved by an Expert!
Get step-by-step solutions from verified subject matter experts
Step: 2 Unlock
Step: 3 Unlock