

Question: The silhouette plot below indicates that Data in Cluster 1 is nearer to the center of Cluster 1. Data in Cluster 0 is nearer to
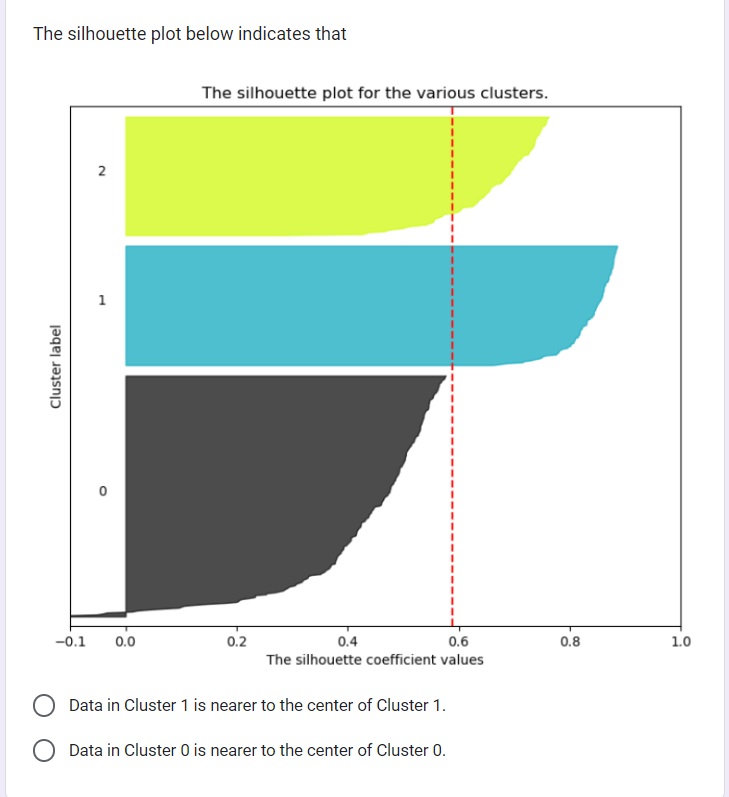
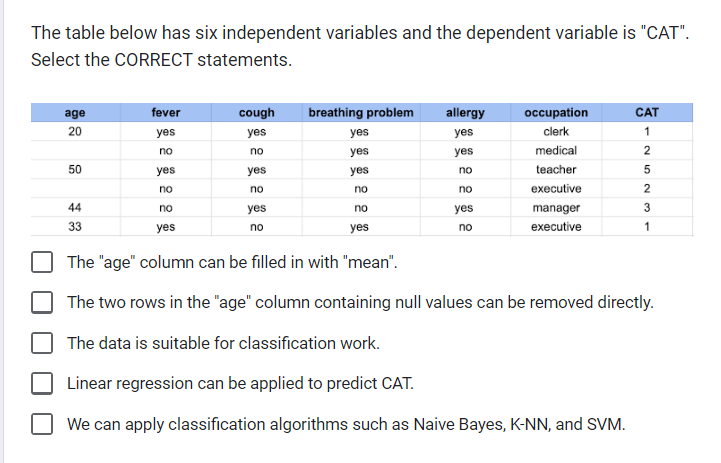
The silhouette plot below indicates that Data in Cluster 1 is nearer to the center of Cluster 1. Data in Cluster 0 is nearer to the center of Cluster 0. The table below has six independent variables and the dependent variable is "CAT". Select the CORRECT statements. The "age" column can be filled in with "mean". The two rows in the "age" column containing null values can be removed directly. The data is suitable for classification work. Linear regression can be applied to predict CAT. We can apply classification algorithms such as Naive Bayes, K-NN, and SVM
Step by Step Solution
There are 3 Steps involved in it
1 Expert Approved Answer
Step: 1 Unlock

Question Has Been Solved by an Expert!
Get step-by-step solutions from verified subject matter experts
Step: 2 Unlock
Step: 3 Unlock