

Question: The S&P has experienced significant increases in Intangible Assets as a Percent of Revenues as Cash has been deployed toward share repurchases and dividends. Tangible
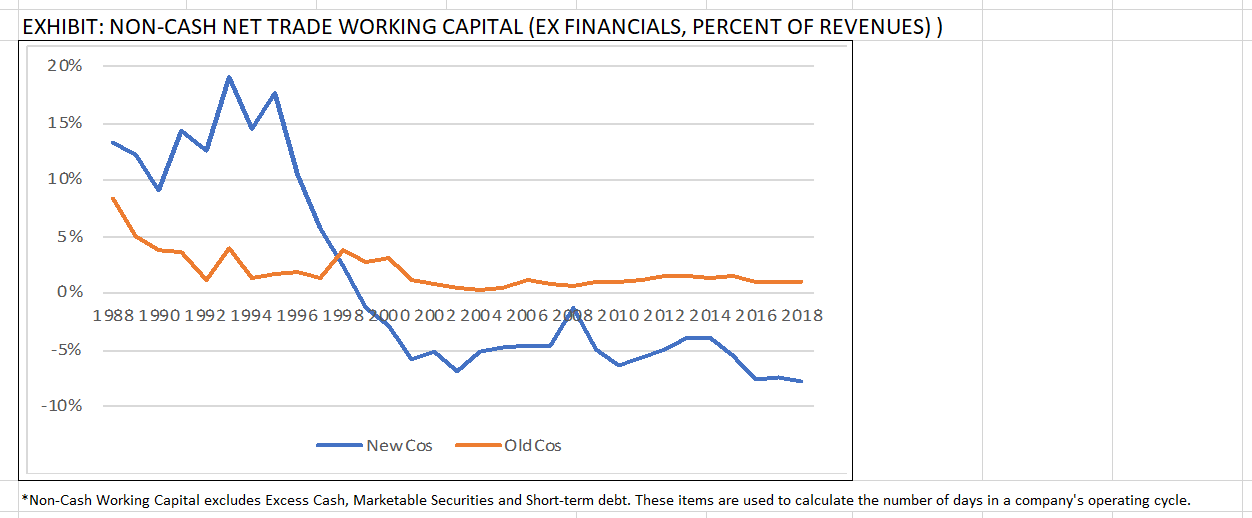
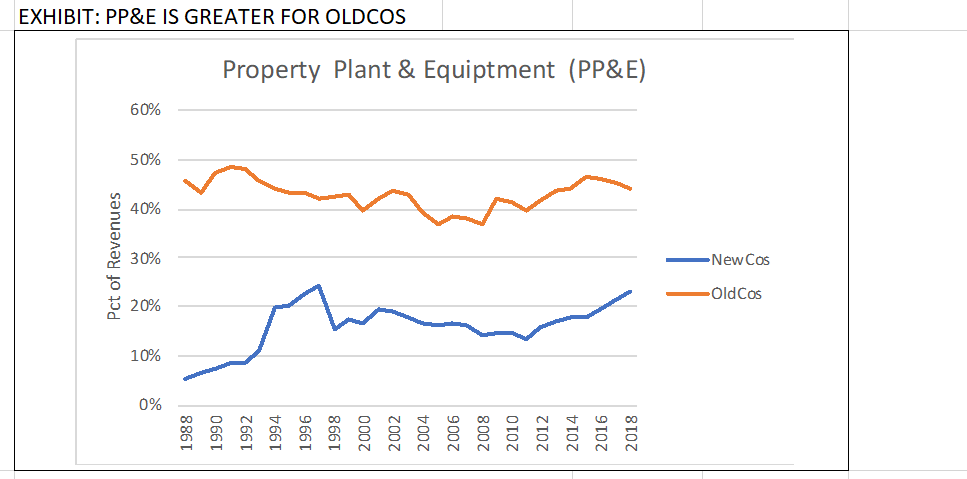
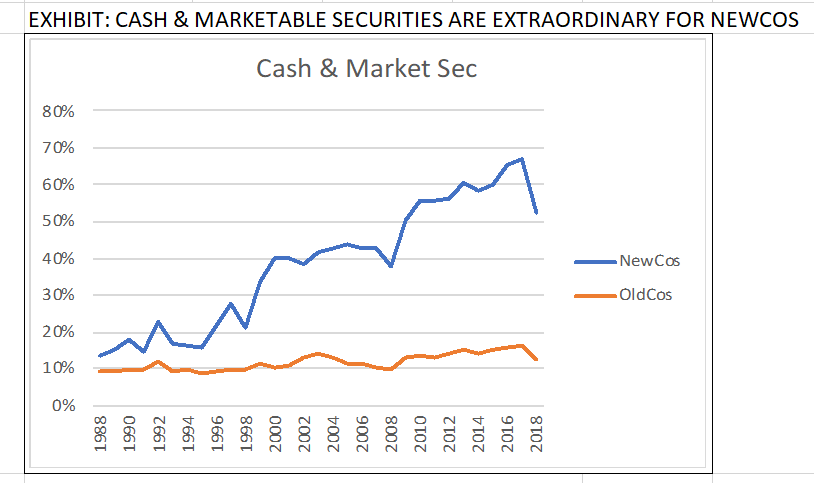
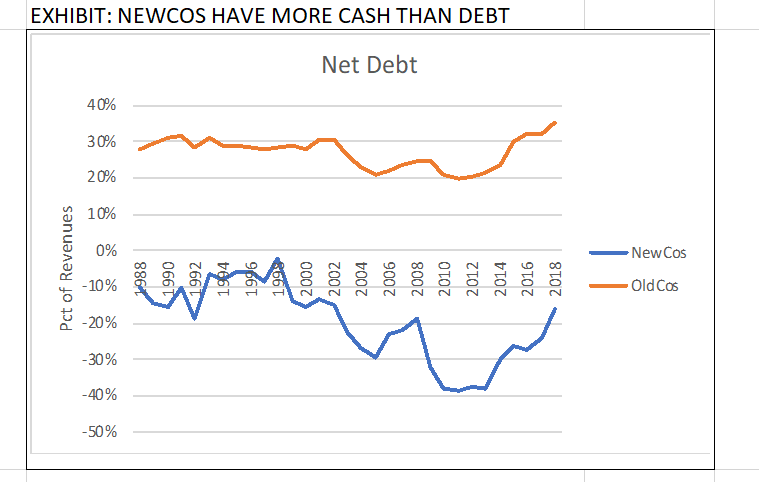
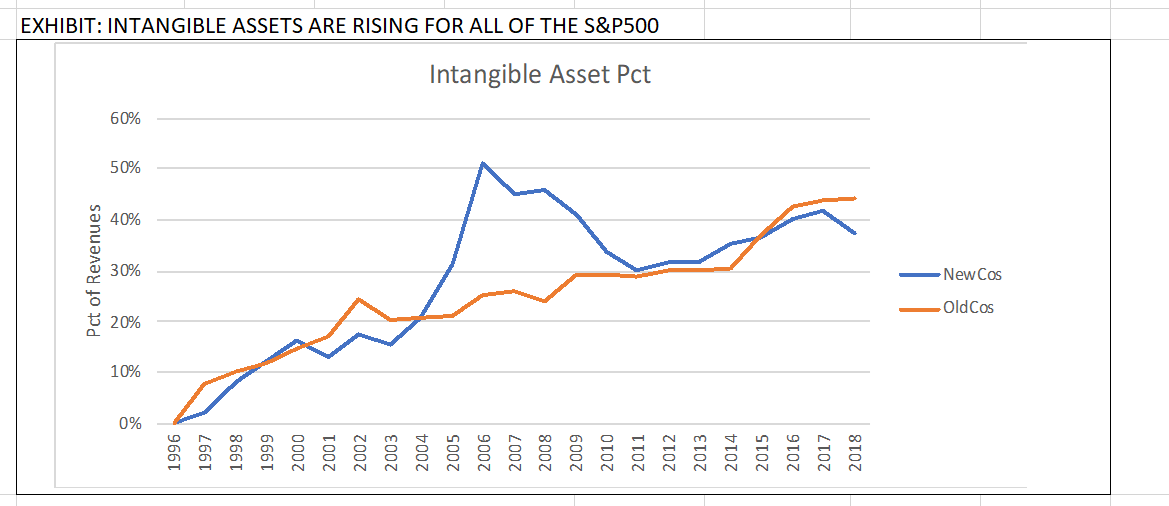
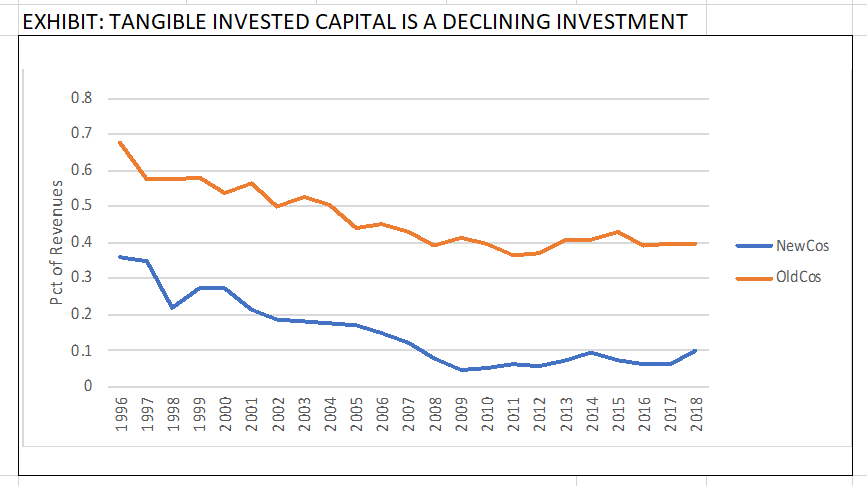
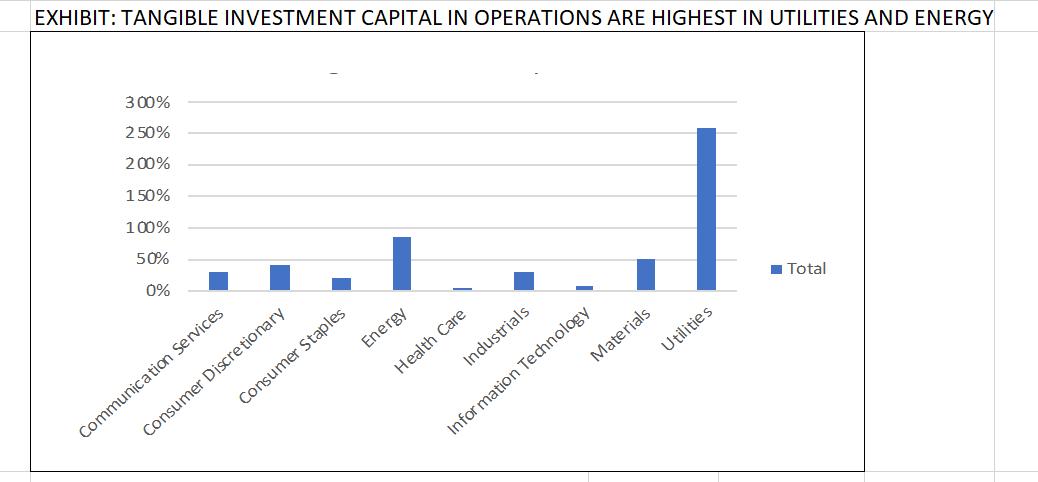
The S&P has experienced significant increases in Intangible Assets as a Percent of Revenues as Cash has been deployed toward share repurchases and dividends. Tangible Invested in Capital has declined consistently and NewCos have invested significantly less than OldCos. OldCos require far higher levels of Non-cash Net Trade Working Capital than NewCos, where figures are negative. Companies have become significantly more capital intensive and NewCos require significantly more PP&E than OldCos. NewCos have accumulated large amounts of Cash and positive Net Cash positions. EXHIBIT: NON-CASH NET TRADE WORKING CAPITAL (EX FINANCIALS, PERCENT OF REVENUES)) 20% 15% 10% 5% 0% 1988 1990 1992 1994 1996 1998 2000 2002 2004 2006 2008 2010 2012 2014 2016 2018 -5% -10% -New Cos Old Cos *Non-Cash Working Capital excludes Excess Cash, Marketable Securities and Short-term debt. These items are used to calculate the number of days in a company's operating cycle. EXHIBIT: PP&E IS GREATER FOR OLDCOS Property Plant & Equiptment (PP&E) 60% 50% 40% Pct of Revenues 30% New Cos Old Cos 20% 10% 0% 1988 1990 1992 1994 1996 1998 2000 2002 2004 2006 2008 2010 EXHIBIT: CASH & MARKETABLE SECURITIES ARE EXTRAORDINARY FOR NEWCOS Cash & Market Sec 80% 70% 60% 50% 40% NewCos 30% OldCos 20% 10% 0% 1988 1990 1992 1994 1996 1998 2000 2002 2004 2006 2008 2010 2012 EXHIBIT: NEWCOS HAVE MORE CASH THAN DEBT Net Debt 40% 30% 20% 10% 0% New Cos Pct of Revenues 886 1990 - 10% 1992 1964 199 1996 2000 2002 2004 2006 2008 2010 2012 2014 2016 2018 Old Cos -20% -30% -40% -50% EXHIBIT: INTANGIBLE ASSETS ARE RISING FOR ALL OF THE S&P500 Intangible Asset Pct 60% 50% 40% Pct of Revenues 30% New Cos Old Cos 20% 10% 0% 1996 1997 1998 1999 11 2000 2001 2002 2003 2004 2005 2006 2007 2008 2000 2009 2010 2011 2011 2012 2013 2014 2015 2016 2017 2018 EXHIBIT: TANGIBLE INVESTED CAPITAL IS A DECLINING INVESTMENT 0.8 0.7 0.6 0.5 Pct of Revenues 0.4 NewCos 0.3 Old Cos 0.2 0.1 0 1996 1997 1998 1999 2000 2001 2002 2003 2004 2005 2006 2007 2008 2009 EXHIBIT: TANGIBLE INVESTMENT CAPITAL IN OPERATIONS ARE HIGHEST IN UTILITIES AND ENERGY 300% 2 50% 200% 1 50% 100% 50% Total 0% Energy Utilities Industrials Materials Health Care Consumer Staples Communication Services Consumer Discretionary Information Technology
Step by Step Solution
There are 3 Steps involved in it

Get step-by-step solutions from verified subject matter experts