

Question: The spectrum shown below was recorded for a compound with molecular formula C 5 H 12 O 2 dissolved in CDCl 3 and using a
The spectrum shown below was recorded for a compound with molecular formula C5H12O2 dissolved in CDCl3 and using a 300 MHz spectrometer. The numbers over the peaks are integrations.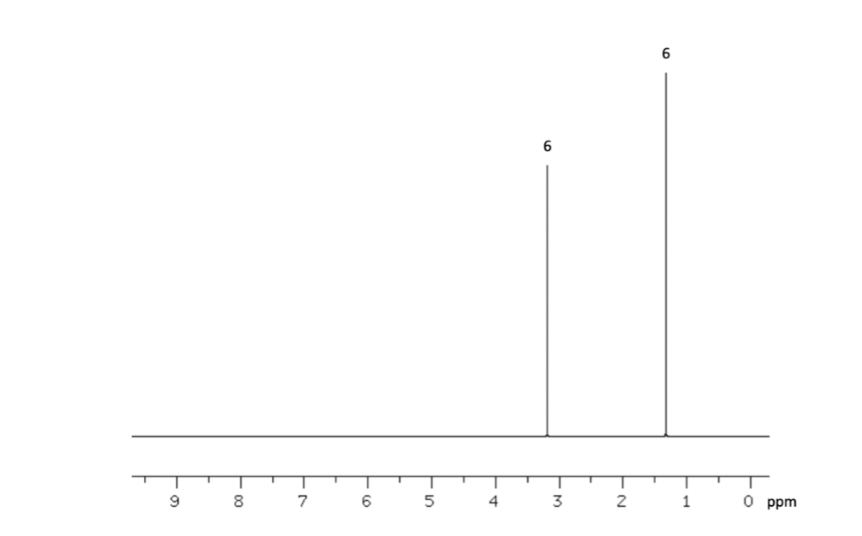
1) Draw the structure of the compound
2) Assign the spectrum by labeling H's in your structure (or in a second drawing of the structure) with the chemical shifts of the corresponding signals
3.) Index the spectrum
4.) How is it possible that the two peaks have different heights but the same integration?
6 6 \begin{tabular}{l|l|l|l|l|l|l|l|l|l|l|l|l|l|l|l} \hline 1 & 1 & 1 & 1 & 1 & 1 & 1 & 1 & 1 & & 1 & & 1 & 1 & 1 \\ 9 & 8 & 7 & 6 & 5 & 4 & 3 & & 2 & 1 & 0 & ppm \end{tabular}
Step by Step Solution
There are 3 Steps involved in it

Get step-by-step solutions from verified subject matter experts