

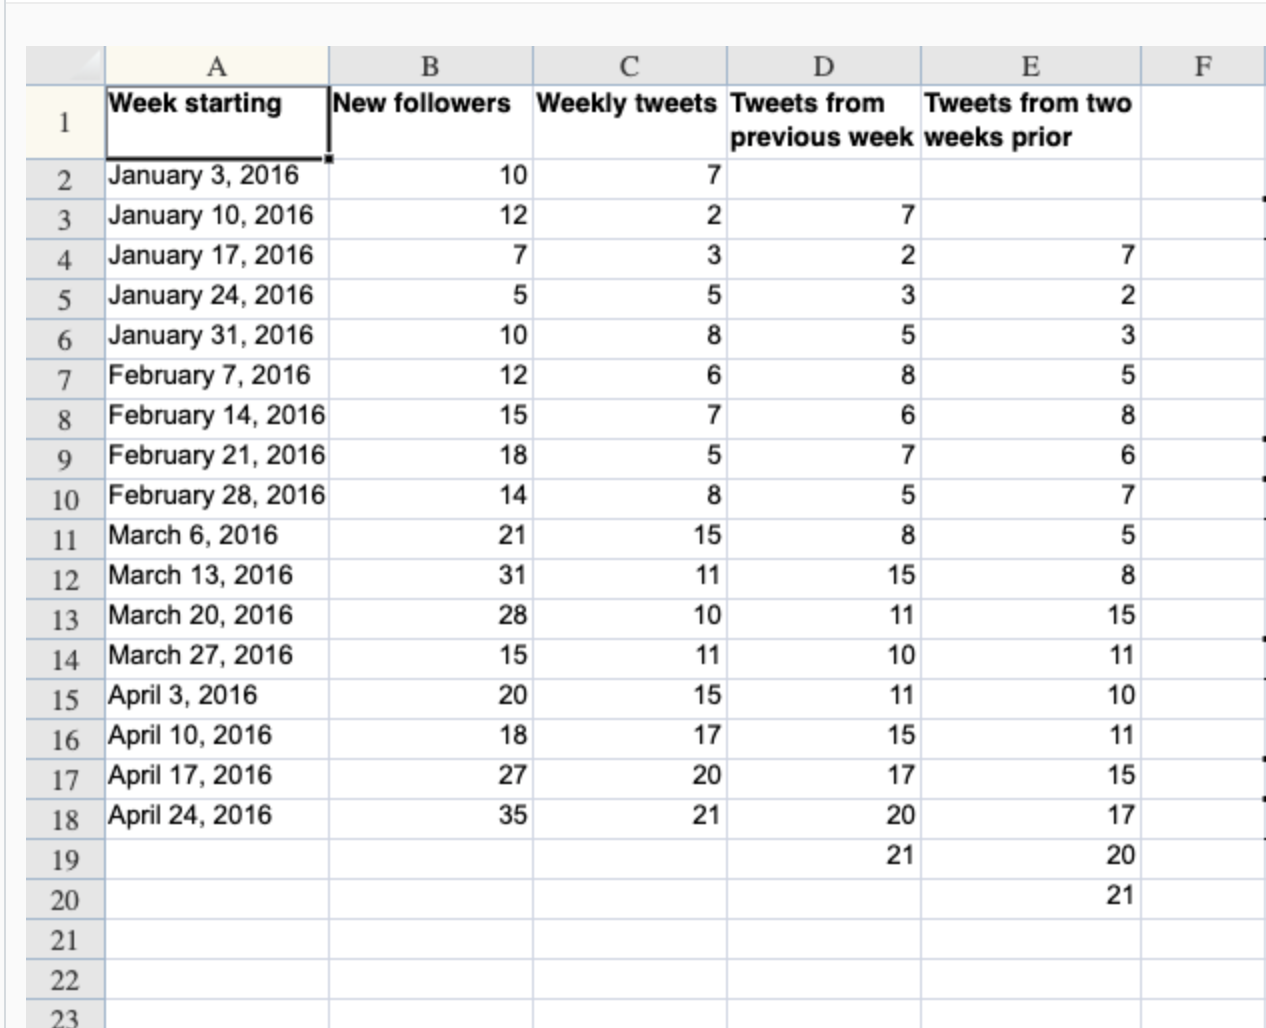
Question: The spreadsheet below contains data about the current and lagged variables from the pop-culture blogger's tweets and the number of followers she gained that week.
The spreadsheet below contains data about the current and lagged variables from the pop-culture blogger's tweets and the number of followers she gained that week. Make a regression model to predict the number of followers from the current week, the previous week, and the two weeks prior. Be sure to include the residuals and residual plots in your analysis.
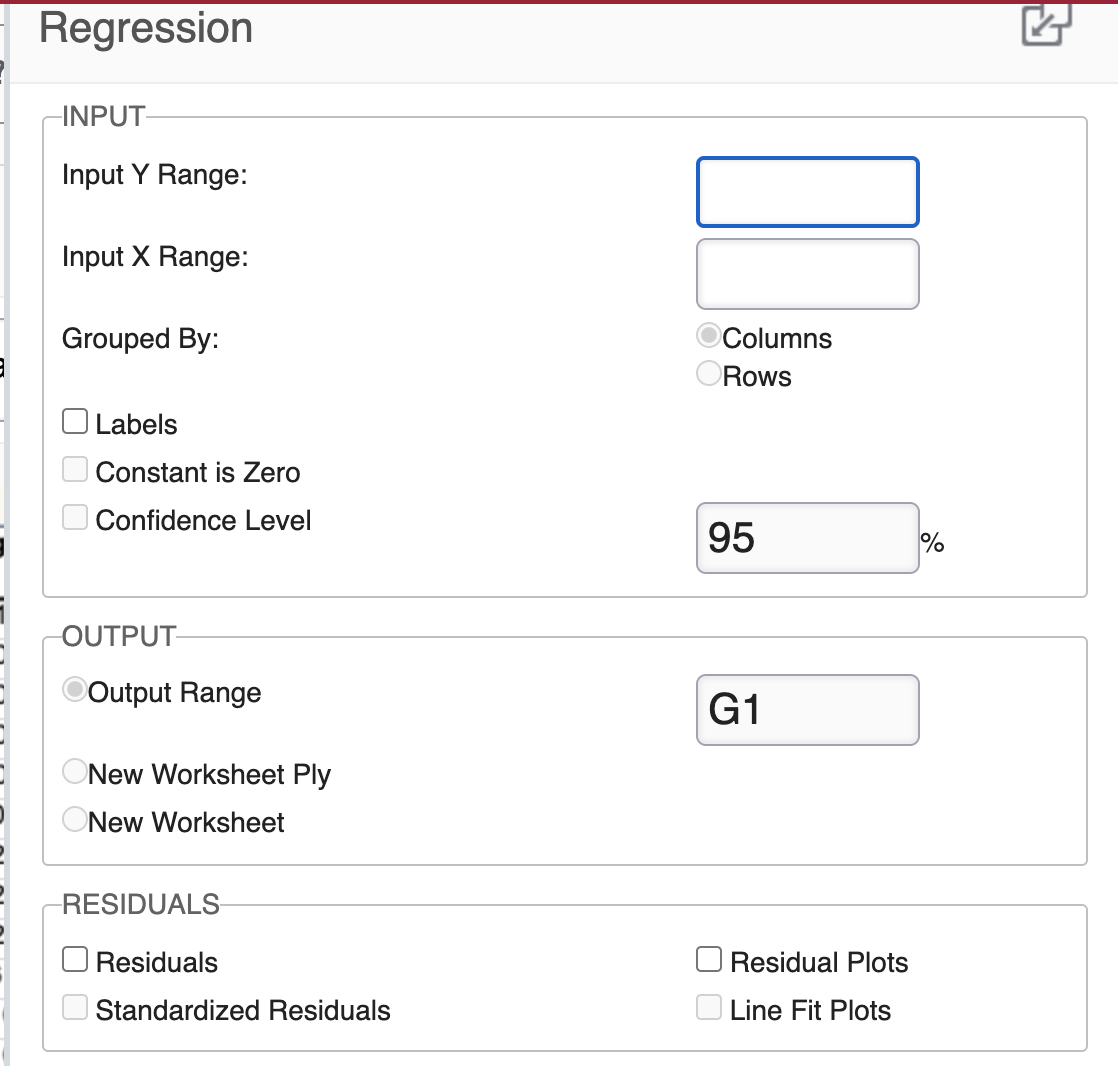
Recall that each lagged variable creates an incomplete line of data. You cannot include blank cells in your regression cell ranges and the labels are no longer contiguous with the data of interest. Thus, you should only select rows with complete data and leave theLabelsbox unchecked.
Note that leaving theLabelsbox unchecked is unique to this data setup (when the lagged data has created blank cells between the number values and the column labels). Generally, you would always want to use labels in a regression.
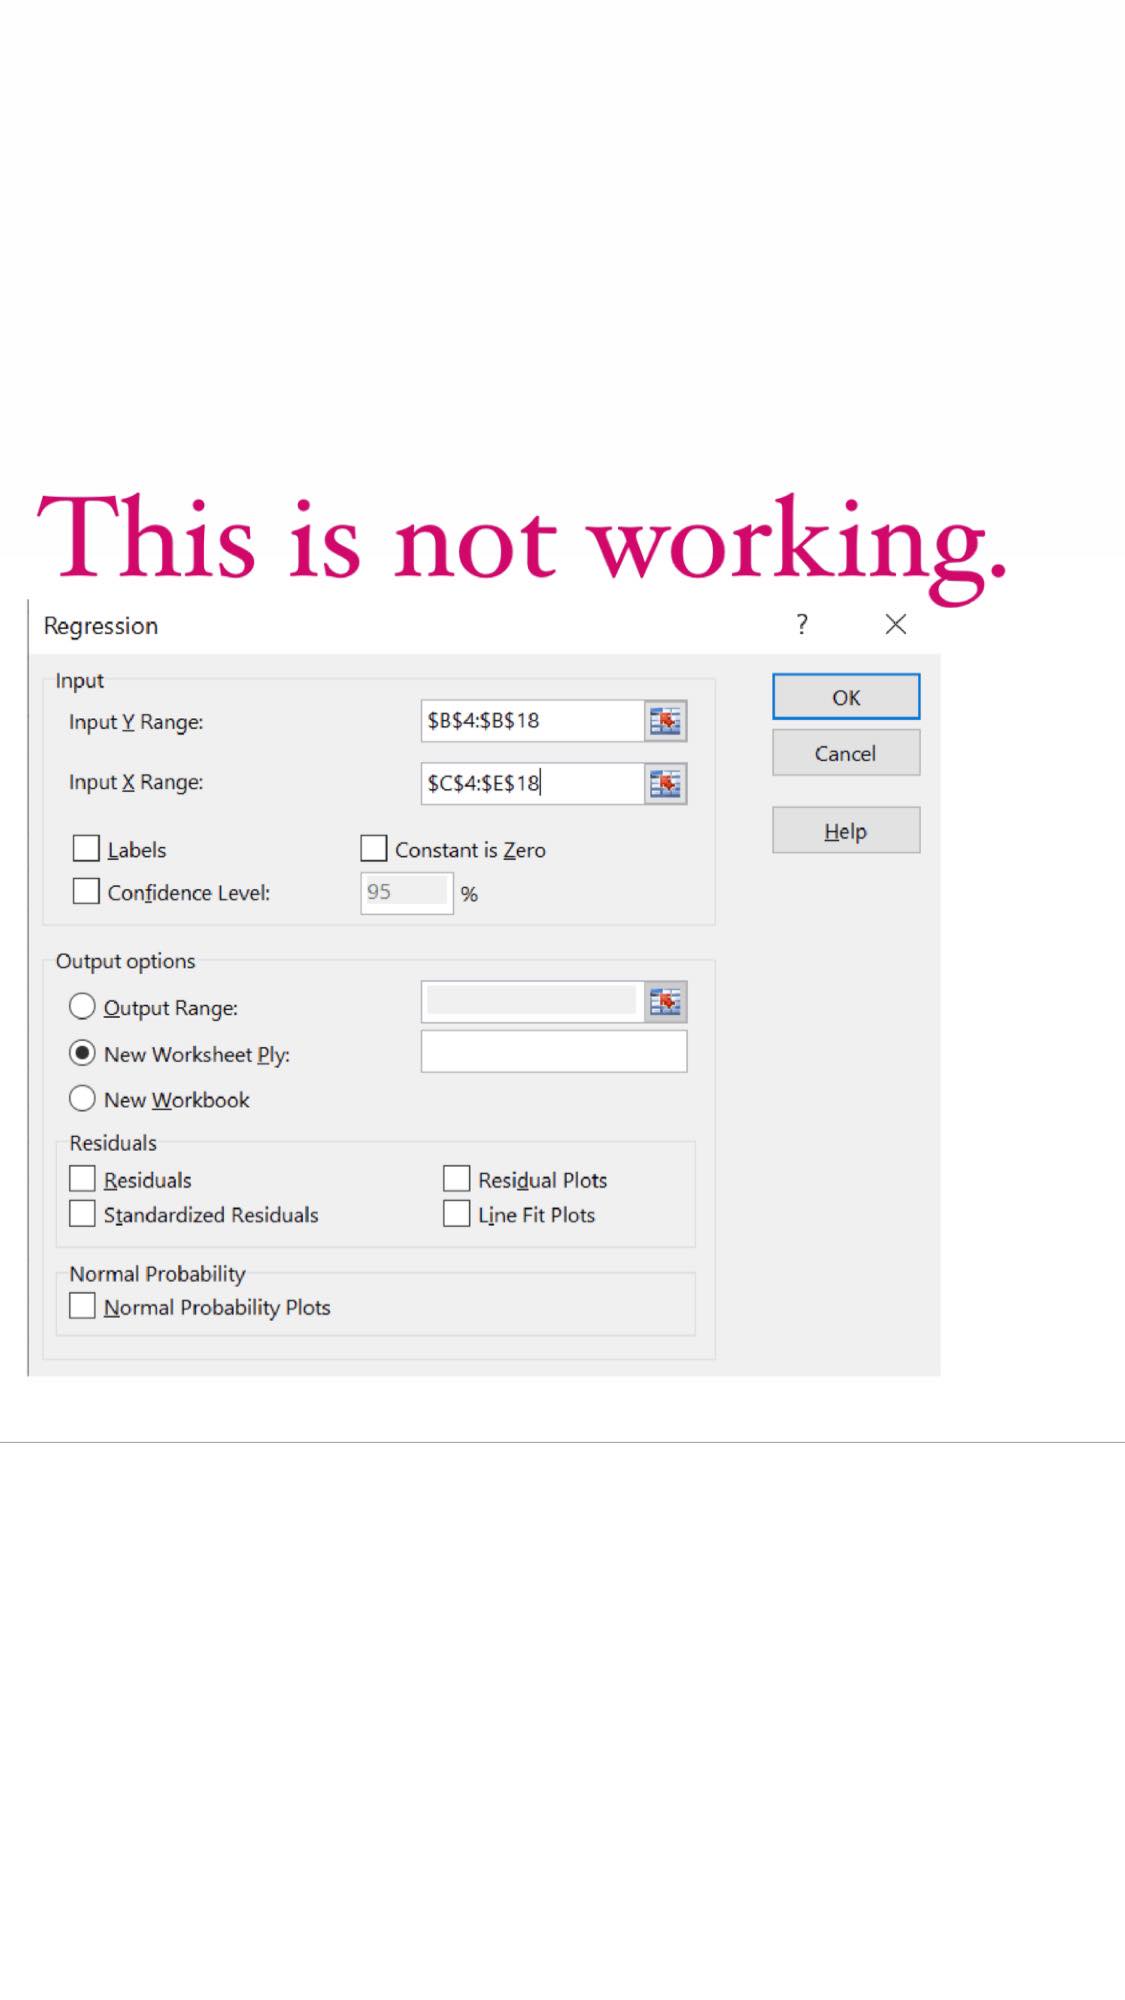
This is not working. Regression ? X Input OK Input Y Range: $B$4:$B$ 18 E Cancel Input X Range: $C$4:$E$ 18 Labels Constant is Zero Help Confidence Level: 95 % Output options O Output Range: New Worksheet Ply: New Workbook Residuals Residuals Residual Plots Standardized Residuals Line Fit Plots Normal Probability Normal Probability PlotsA B C D E F Week starting New followers Weekly tweets Tweets from Tweets from two previous week weeks prior 2 January 3, 2016 10 3 January 10, 2016 12 N 4 January 17, 2016 7 5 January 24, 2016 5 6 January 31, 2016 10 8 7 February 7, 2016 12 8 February 14, 2016 15 9 February 21, 2016 18 10 February 28, 2016 14 8 11 March 6, 2016 21 15 12 March 13, 2016 31 13 March 20, 2016 28 10 11 14 March 27, 2016 15 11 10 11 15 April 3, 2016 20 15 11 10 16 April 10, 2016 18 17 15 11 17 April 17, 2016 27 20 17 15 18 April 24, 2016 35 21 20 17 19 21 20 20 21 21 22 23- Regression @ l INPUT Input Y Range: Input X Range: Grouped By: Columns i Rows C] Labels Constant is Zero Confidence Level UTPUT Output Range New Worksheet Ply New Worksheet RESIDUALS C] Residuals C] Residual Plots l Standardized Residuals Line Fit Plots
Step by Step Solution
There are 3 Steps involved in it

Get step-by-step solutions from verified subject matter experts