

Question: The spreadsheet below has data on Microsoft and the S&P 500 from 1986 to 2006. Complete the steps below using cell references to given data
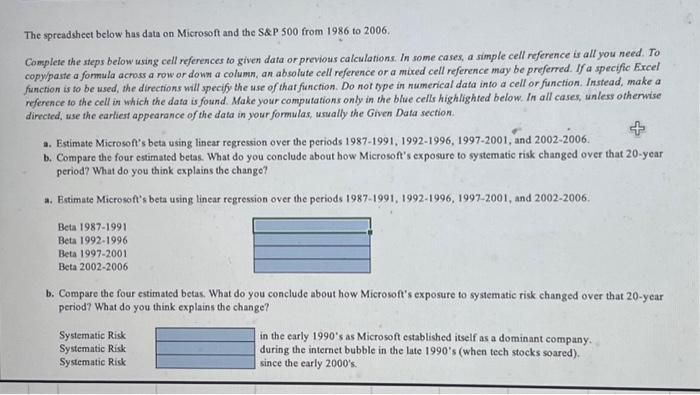
The spreadsheet below has data on Microsoft and the S\&P 500 from 1986 to 2006. Complete the steps below using cell references to given data or previous calculations. In some cases, a simple cell reference is all you need. To copylpaite a formula across a row or down a column, an absolute cell reference or a mixed cell reference may be preferred. If a specific Eixcel function is to be used, the directions will specify the use of that function. Do not type in numerical data into a cell or function. Instead, make a reference to the cell in which the data is found. Make your computations only in the blue cells highlighted below. In all cases, snless otherwise directed, wse the earliest appearance of the data in your formulas, wwally the Given Data section. a. Estimate Microsoft's beta using linear regression over the periods 1987-1991, 1992-1996, 1997-2001, and 2002-2006. b. Compare the four estimated betas. What do you conclude about bow Microsof's exposure to systematic risk changed over that 20 -year period? What do you think explains the change? a. Estimate Microsof's beta using linear regression over the periods 1987-1991, 1992-1996, 1997-2001, and 2002-2006. Beta 1987-1991 Beta 1992-1996 Beta 1997-2001 Beta 2002-2006 b. Compare the four estimated betas. What do you conclude about how Microsoft's exposure to systematic risk changed over that 20 -year period? What do you think explains the change? Systematic Risk in the early 1990's as Microsoft established itself as a dominant company. Systematic Risk during the internet bubble in the late 1990 's (when tech stocks soared). Systematic Rick since the early 2000 's
Step by Step Solution
There are 3 Steps involved in it

Get step-by-step solutions from verified subject matter experts