

Question: The stacked-column chart on the screen is based on the program data and your answers. Identify what this chart describes. What does each section of
- The stacked-column chart on the screen is based on the program data and your answers.
- Identify what this chart describes.
- What does each section of the bars represent?
| A | |
| B | |
| C | |
| D |
- What would be an appropriate title for this chart?
This is the data used for the chart and the chart is way below in the picture
| ABC | ||||
| Activity-Based Costing | ||||
| Data Section | ||||
| Overhead Item | Expected Cost | Cost Driver | Quantity | |
| Setup costs | $24,000 | Number of setups | 60 | |
| Ordering costs | 9,000 | Number of orders | 900 | |
| Machine costs | 36,000 | Machine hours | 36,000 | |
| Power | 5,000 | Kilowatt hours | 100,000 | |
| Bubble | Burst | Bump | ||
| Direct materials | $1,300 | $1,525 | $1,250 | |
| Direct labor | $900 | $900 | $800 | |
| Units completed | 800 | 500 | 600 | |
| Number of setups | 6 | 10 | 3 | |
| Number of orders | 60 | 120 | 2 | |
| Machine hours | 1,500 | 2,000 | 2,500 | |
| Kilowatt hours | 6,000 | 5,000 | 2,000 | |
| Answer Section | ||||
| Pool Rates | ||||
| Setup | $400.00 | per setup | ||
| Ordering | $10.00 | per order | ||
| Machine Costs | $1.00 | per machine hour | ||
| Power | $0.05 | per kilowatt hour | ||
| Product Costs | ||||
| Bubble | Burst | Bump | ||
| Direct materials | $1,300 | $1,525 | $1,250 | |
| Direct labor | 900 | 900 | 800 | |
| Overhead | ||||
| Setups | 2,400 | 4,000 | 1,200 | |
| Ordering | 600 | 1,200 | 20 | |
| Machine costs | 1,500 | 2,000 | 2,500 | |
| Power | 300 | 250 | 100 | |
| Total cost | $7,000 | $9,875 | $5,870 | |
| Unit cost | $8.75 | $19.75 | $9.78 | |
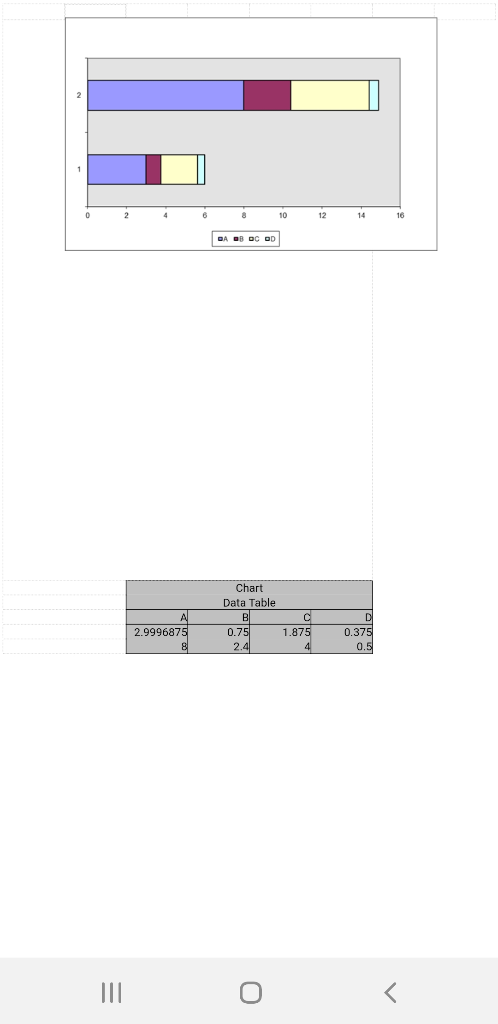 | ||||
1012 Chart Data Table BI 2.9996875 0.75 2.4
Step by Step Solution
There are 3 Steps involved in it
1 Expert Approved Answer
Step: 1 Unlock

Question Has Been Solved by an Expert!
Get step-by-step solutions from verified subject matter experts
Step: 2 Unlock
Step: 3 Unlock