

Question: The Standard Atmosphere temperature profile can be described using the following graph, divided into isothermal and gradient regions: 105 100 225.66 K 24-4 x 10⁻³
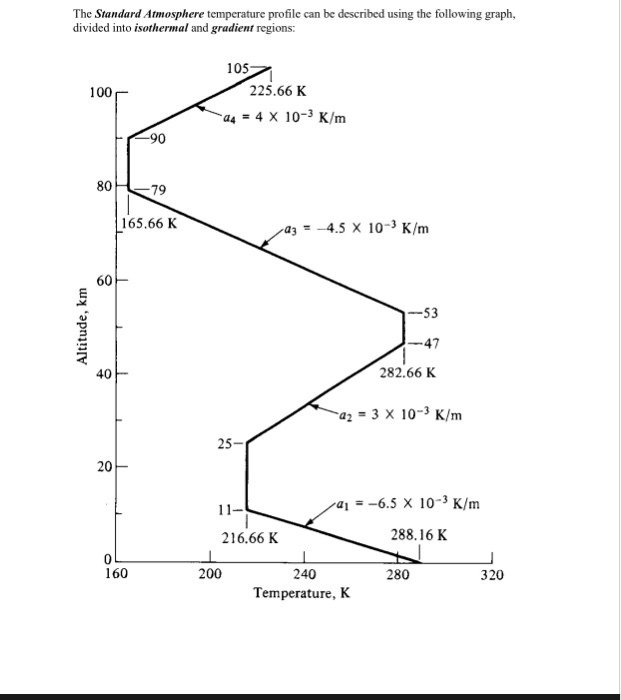
The Standard Atmosphere temperature profile can be described using the following graph, divided into isothermal and gradient regions: 105 100 225.66 K 24-4 x 10⁻³ K/m 90 8079 65.66 K a3 =-4.5 X 10⁻³ K/m 60 53 47 282.66 K a 40 a2- 3 x 10⁻³ K/m 25- 20 a!--6.5 x 10⁻³ K/m 216.66 K 288.16 K 160 240 Temperature, K 200 280 320
Step by Step Solution
There are 3 Steps involved in it
1 Expert Approved Answer
Step: 1 Unlock

Question Has Been Solved by an Expert!
Get step-by-step solutions from verified subject matter experts
Step: 2 Unlock
Step: 3 Unlock