

Question: The Stata output attached in Table 3 shows the effect of percent of residents ages 25 and up with at least a high school education
The Stata output attached in Table 3 shows the effect of percent of residents ages 25 and up with at least a high school education on crime rate Using Table 3, answer the following, rounding 2 decimal places in each step:
- Find and interpret the correlation coefficient.
- Find the prediction equation.
- Find and interpret the y-intercept.
- Find and interpret the slope.
- Find and interpret r2.
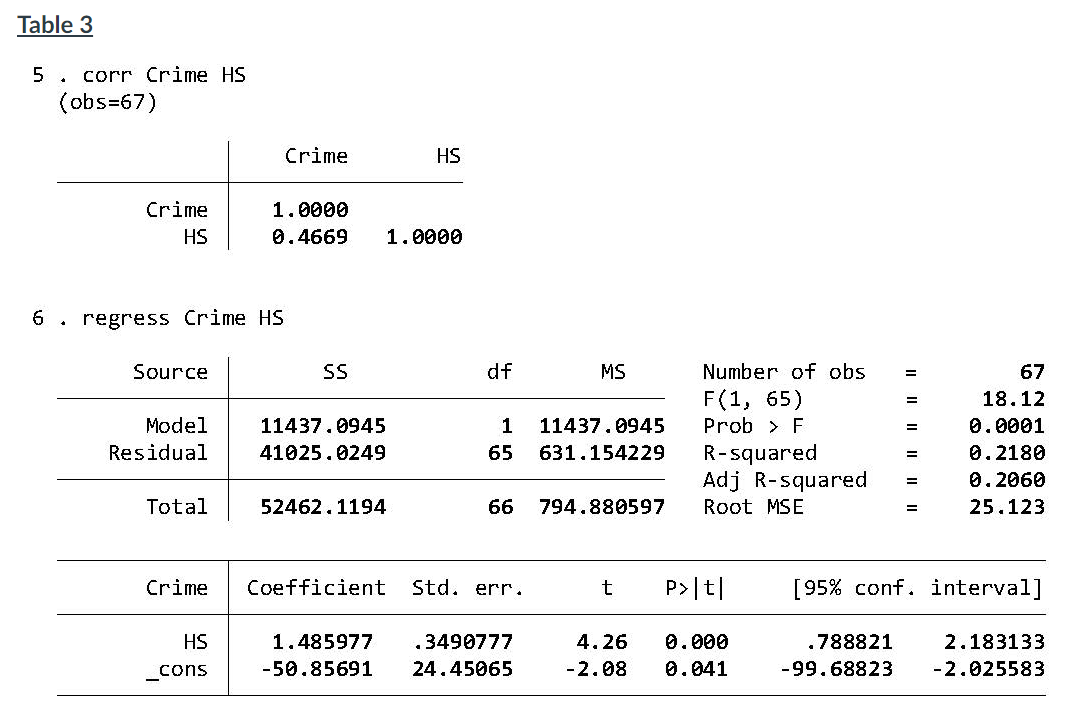
Table 3 5 . corr Crime HS (obs=67) Crime HS Crime 1 . 0900 HS 0. 4669 1. 0000 6 . regress Crime HS Source SS df MS Number of obs = 67 F (1, 65) = 18. 12 Model 11437 . 0945 1 11437.0945 Prob > F = 0. 0001 Residual 41025 . 0249 65 631.154229 R - squared = 0. 2180 Adj R-squared = 0. 2060 Total 52462 . 1194 66 794.880597 Root MSE 25.123 Crime Coefficient Std. err. t P>| t [95% conf. interval] HS 1. 485977 . 3490777 4. 26 0. 000 .788821 2. 183133 _cons -50.85691 24 . 45065 -2.08 0. 041 -99. 68823 -2.025583
Step by Step Solution
There are 3 Steps involved in it

Get step-by-step solutions from verified subject matter experts