

Question: The stem and leaf plot below lists the ages (in years) at the time of the award of the Nobel Prize winners in Economics
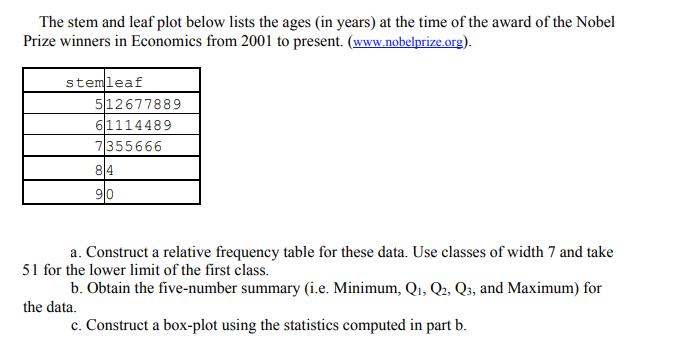
The stem and leaf plot below lists the ages (in years) at the time of the award of the Nobel Prize winners in Economics from 2001 to present. (www.nobelprize.org). stemleaf 512677889 61114489 7355666 84 90 a. Construct a relative frequency table for these data. Use classes of width 7 and take 51 for the lower limit of the first class. b. Obtain the five-number summary (i.e. Minimum, Q, Q2, Q3, and Maximum) for the data. c. Construct a box-plot using the statistics computed in part b.
Step by Step Solution
3.33 Rating (147 Votes )
There are 3 Steps involved in it
The detailed ... View full answer

Get step-by-step solutions from verified subject matter experts