

Question: The Stemple Corporation data for the current year: Account Current assets A/R Mdse. Inventory Current liabilities Long-term liabilities Common stock (5,000 shares) Retained eamings Net
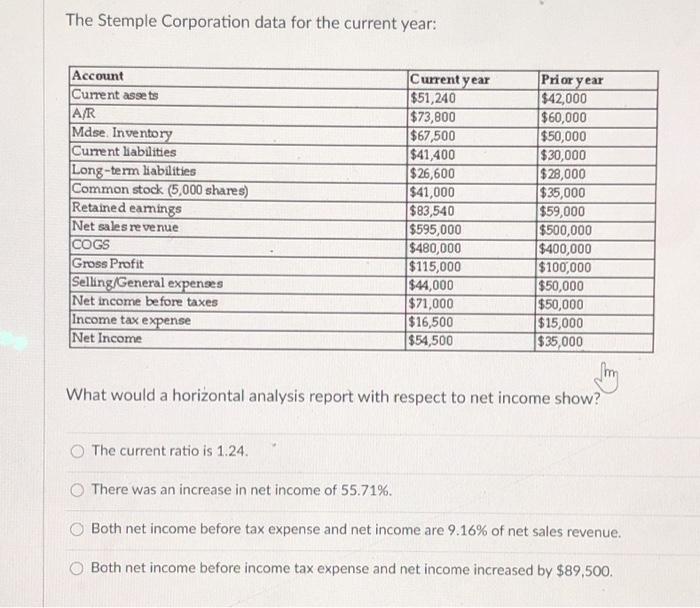
The Stemple Corporation data for the current year: Account Current assets A/R Mdse. Inventory Current liabilities Long-term liabilities Common stock (5,000 shares) Retained eamings Net sales revenue COGS Gross Profit Selling/General expenses Net income before taxes Income tax expense Net Income Current year $51,240 $73,800 $67,500 $41,400 $26,600 $41,000 $83,540 $595,000 $480,000 $115,000 $44,000 $71,000 $16,500 $54,500 Prior year $42,000 $60,000 $50,000 $30,000 $28,000 $35,000 $59,000 $500,000 $400,000 $100,000 $50,000 $50,000 $15,000 $35,000 What would a horizontal analysis report with respect to net income show? The current ratio is 1.24. There was an increase in net income of 55.71%. Both net income before tax expense and net income are 9.16% of net sales revenue. Both net income before income tax expense and net income increased by $89,500
Step by Step Solution
There are 3 Steps involved in it

Get step-by-step solutions from verified subject matter experts