

Question: The supply chain team used Excel's Solver program to arrive at the lowest-cost network design shown in Figure 1. How much is the overall
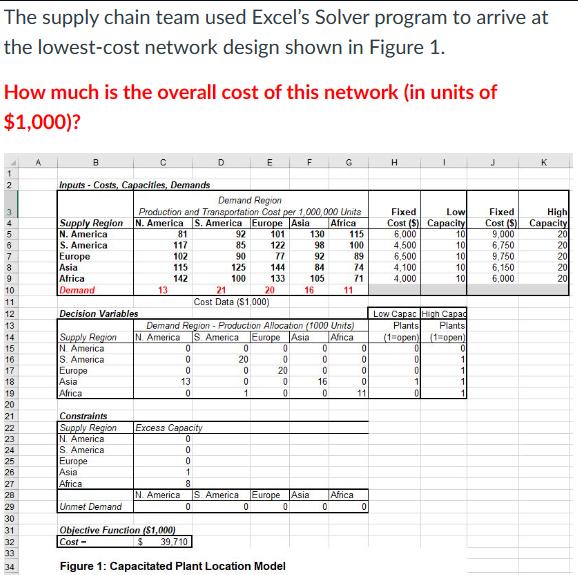
The supply chain team used Excel's Solver program to arrive at the lowest-cost network design shown in Figure 1. How much is the overall cost of this network (in units of $1,000)? 1 2 3 4 5 6 7 8 9 10 11 12 13 14 15 16 17 18 19 20 21 22 23 24 25 26 27 28 29 30 31 32 33 34 Inputs-Costs, Capacities, Demands Supply Region N. America S. America Europe Asia Africa Demand Decision Variables Supply Region N. America S. America Europe Asia Africa Constraints Supply Region N. America S. America Europe Asia Africa Demand Region Production and Transportation Cost per 1,000,000 Units N. America S. America Europe Asia Africa 13 81 117 102 115 142 0 0 0 D 13 0 92 85 90 125 100 0 20 0 21 Cost Data ($1,000) Excess Capacity 0 0 0 1 8 N. America S. America 0 101 122 0 1 77 144 133 Demand Region - Production Allocation (1000 Units) N. America S. America Europe Asia Africa 20 0 0 0 20 0 0 Unmet Demand Objective Function ($1,000) Cost- $ 39,710 Figure 1: Capacitated Plant Location Model 130 115 98 100 89 74 71 Europe Asia 0 92 84 105 16 0 0 0 16 0 11 0 Africal 0 0 0 0 11 0 H Low Fixed Cost (S) Capacity 6,000 4,500 6,500 4,100 4,000 10 0 0 0 11 0 10 10 10 10 Low Capac High Capad Plants Plants (1-open) (1-open) 0 1 1 1 Fixed Cost (S) 9,000 6,750 9,750 6,150 6,000 High Capacity 20 20 20 20 20
Step by Step Solution
3.38 Rating (157 Votes )
There are 3 Steps involved in it
To calculate the overall cost of the network design shown in Figure 1 consider the costs associated ... View full answer

Get step-by-step solutions from verified subject matter experts