

Question: The table and scatterplot below describe the relationship between latitude and average July temperature in the twelve largest U.S. cities. City Latitude (x) July Temp
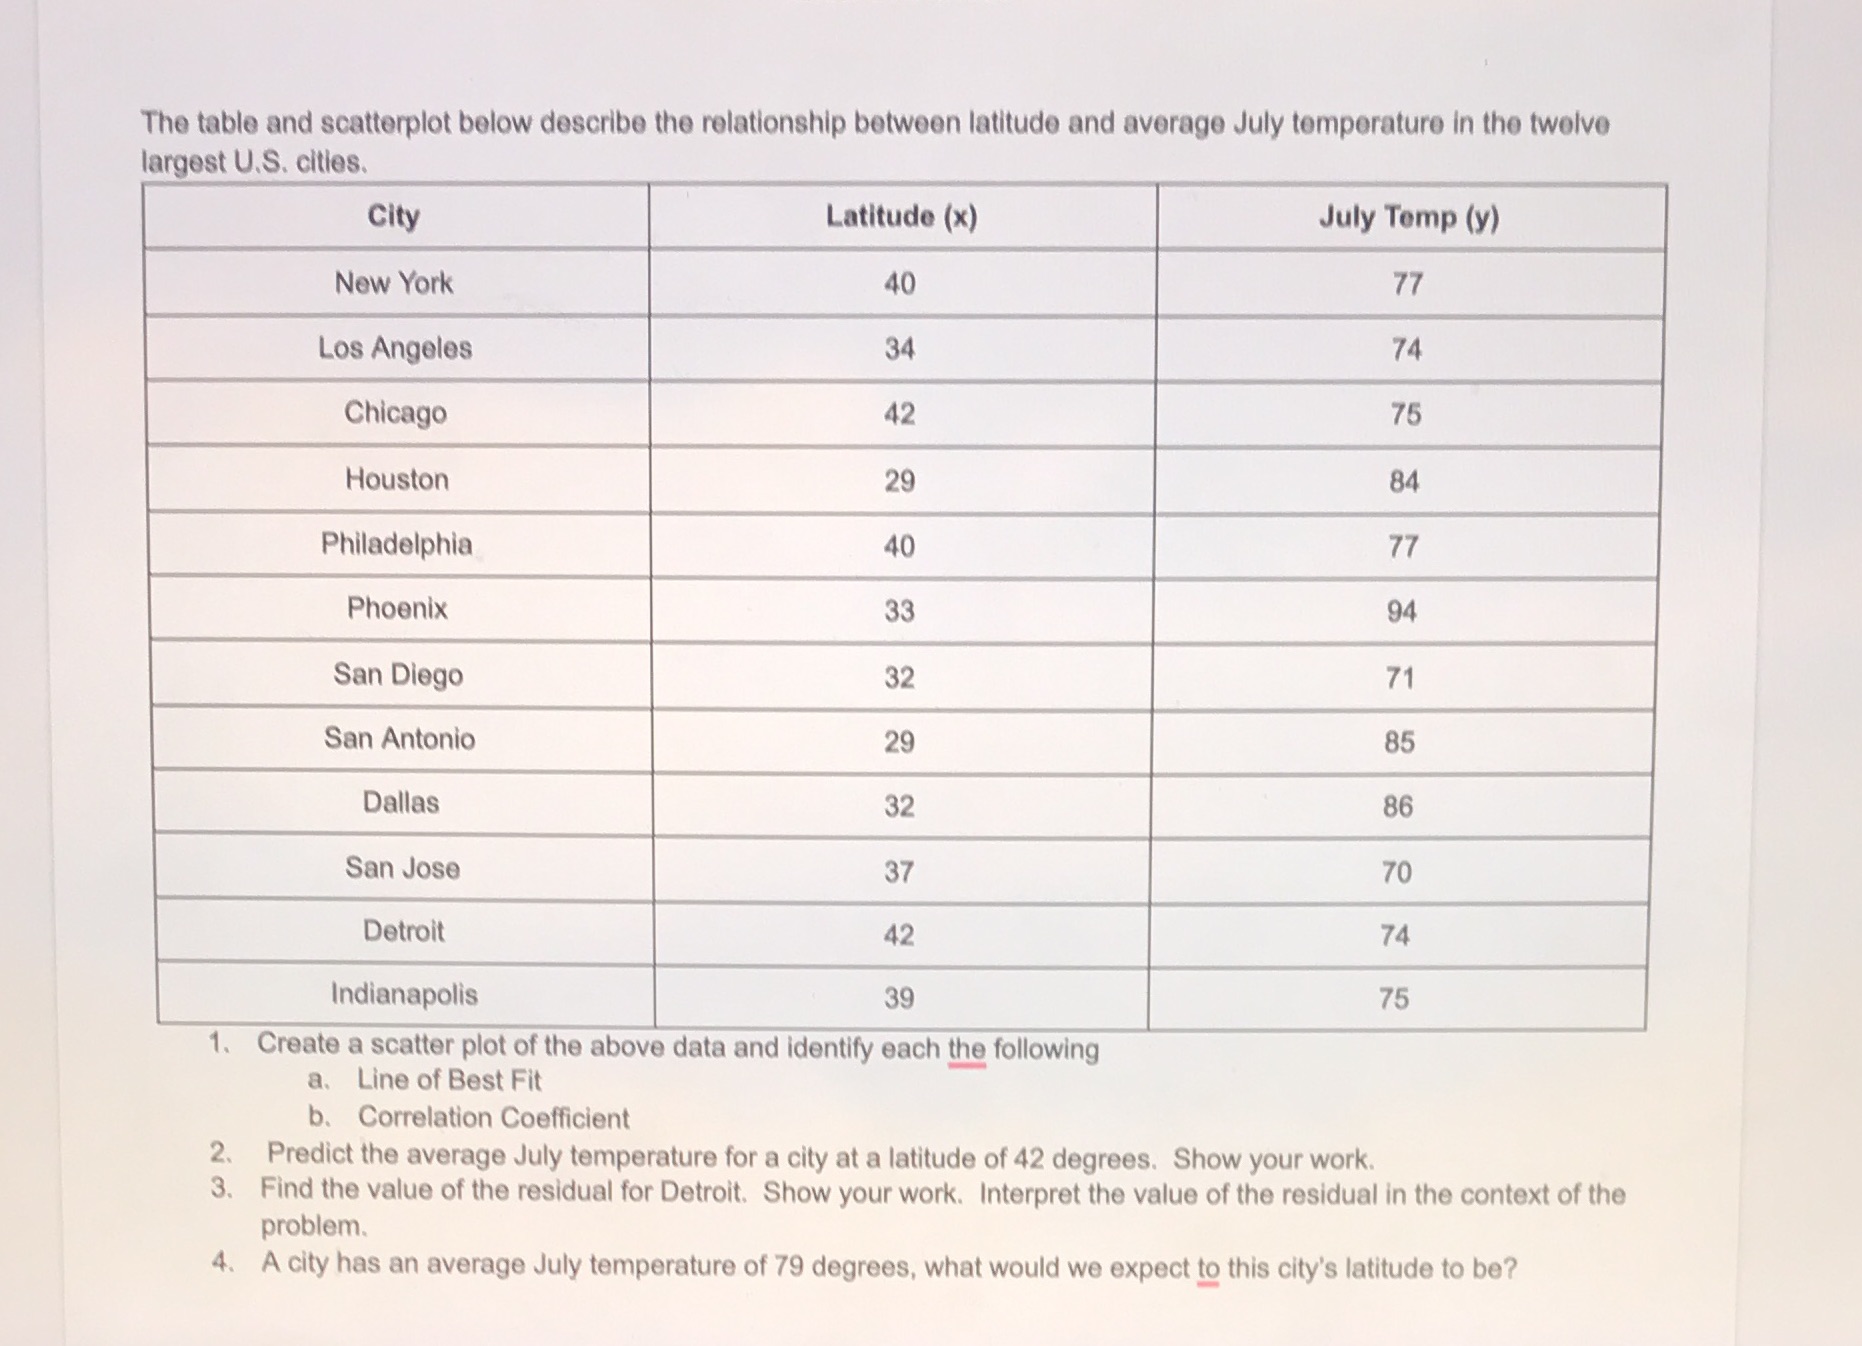
The table and scatterplot below describe the relationship between latitude and average July temperature in the twelve largest U.S. cities. City Latitude (x) July Temp (y) New York 40 77 Los Angeles 34 74 Chicago 42 75 Houston 29 84 Philadelphia 40 77 Phoenix 33 94 San Diego 32 71 San Antonio 29 85 Dallas 32 86 San Jose 37 70 Detroit 42 74 Indianapolis 39 75 1. Create a scatter plot of the above data and identify each the following a. Line of Best Fit b. Correlation Coefficient 2. Predict the average July temperature for a city at a latitude of 42 degrees. Show your work. 3. Find the value of the residual for Detroit. Show your work. Interpret the value of the residual in the context of the problem. 4. A city has an average July temperature of 79 degrees, what would we expect to this city's latitude to be
Step by Step Solution
There are 3 Steps involved in it

Get step-by-step solutions from verified subject matter experts