

Question: The table below contains short-run cost data for five different plant sizes of the R2D2 Robotics Company. Plant 1 Plant 2 Plant 3 Plant
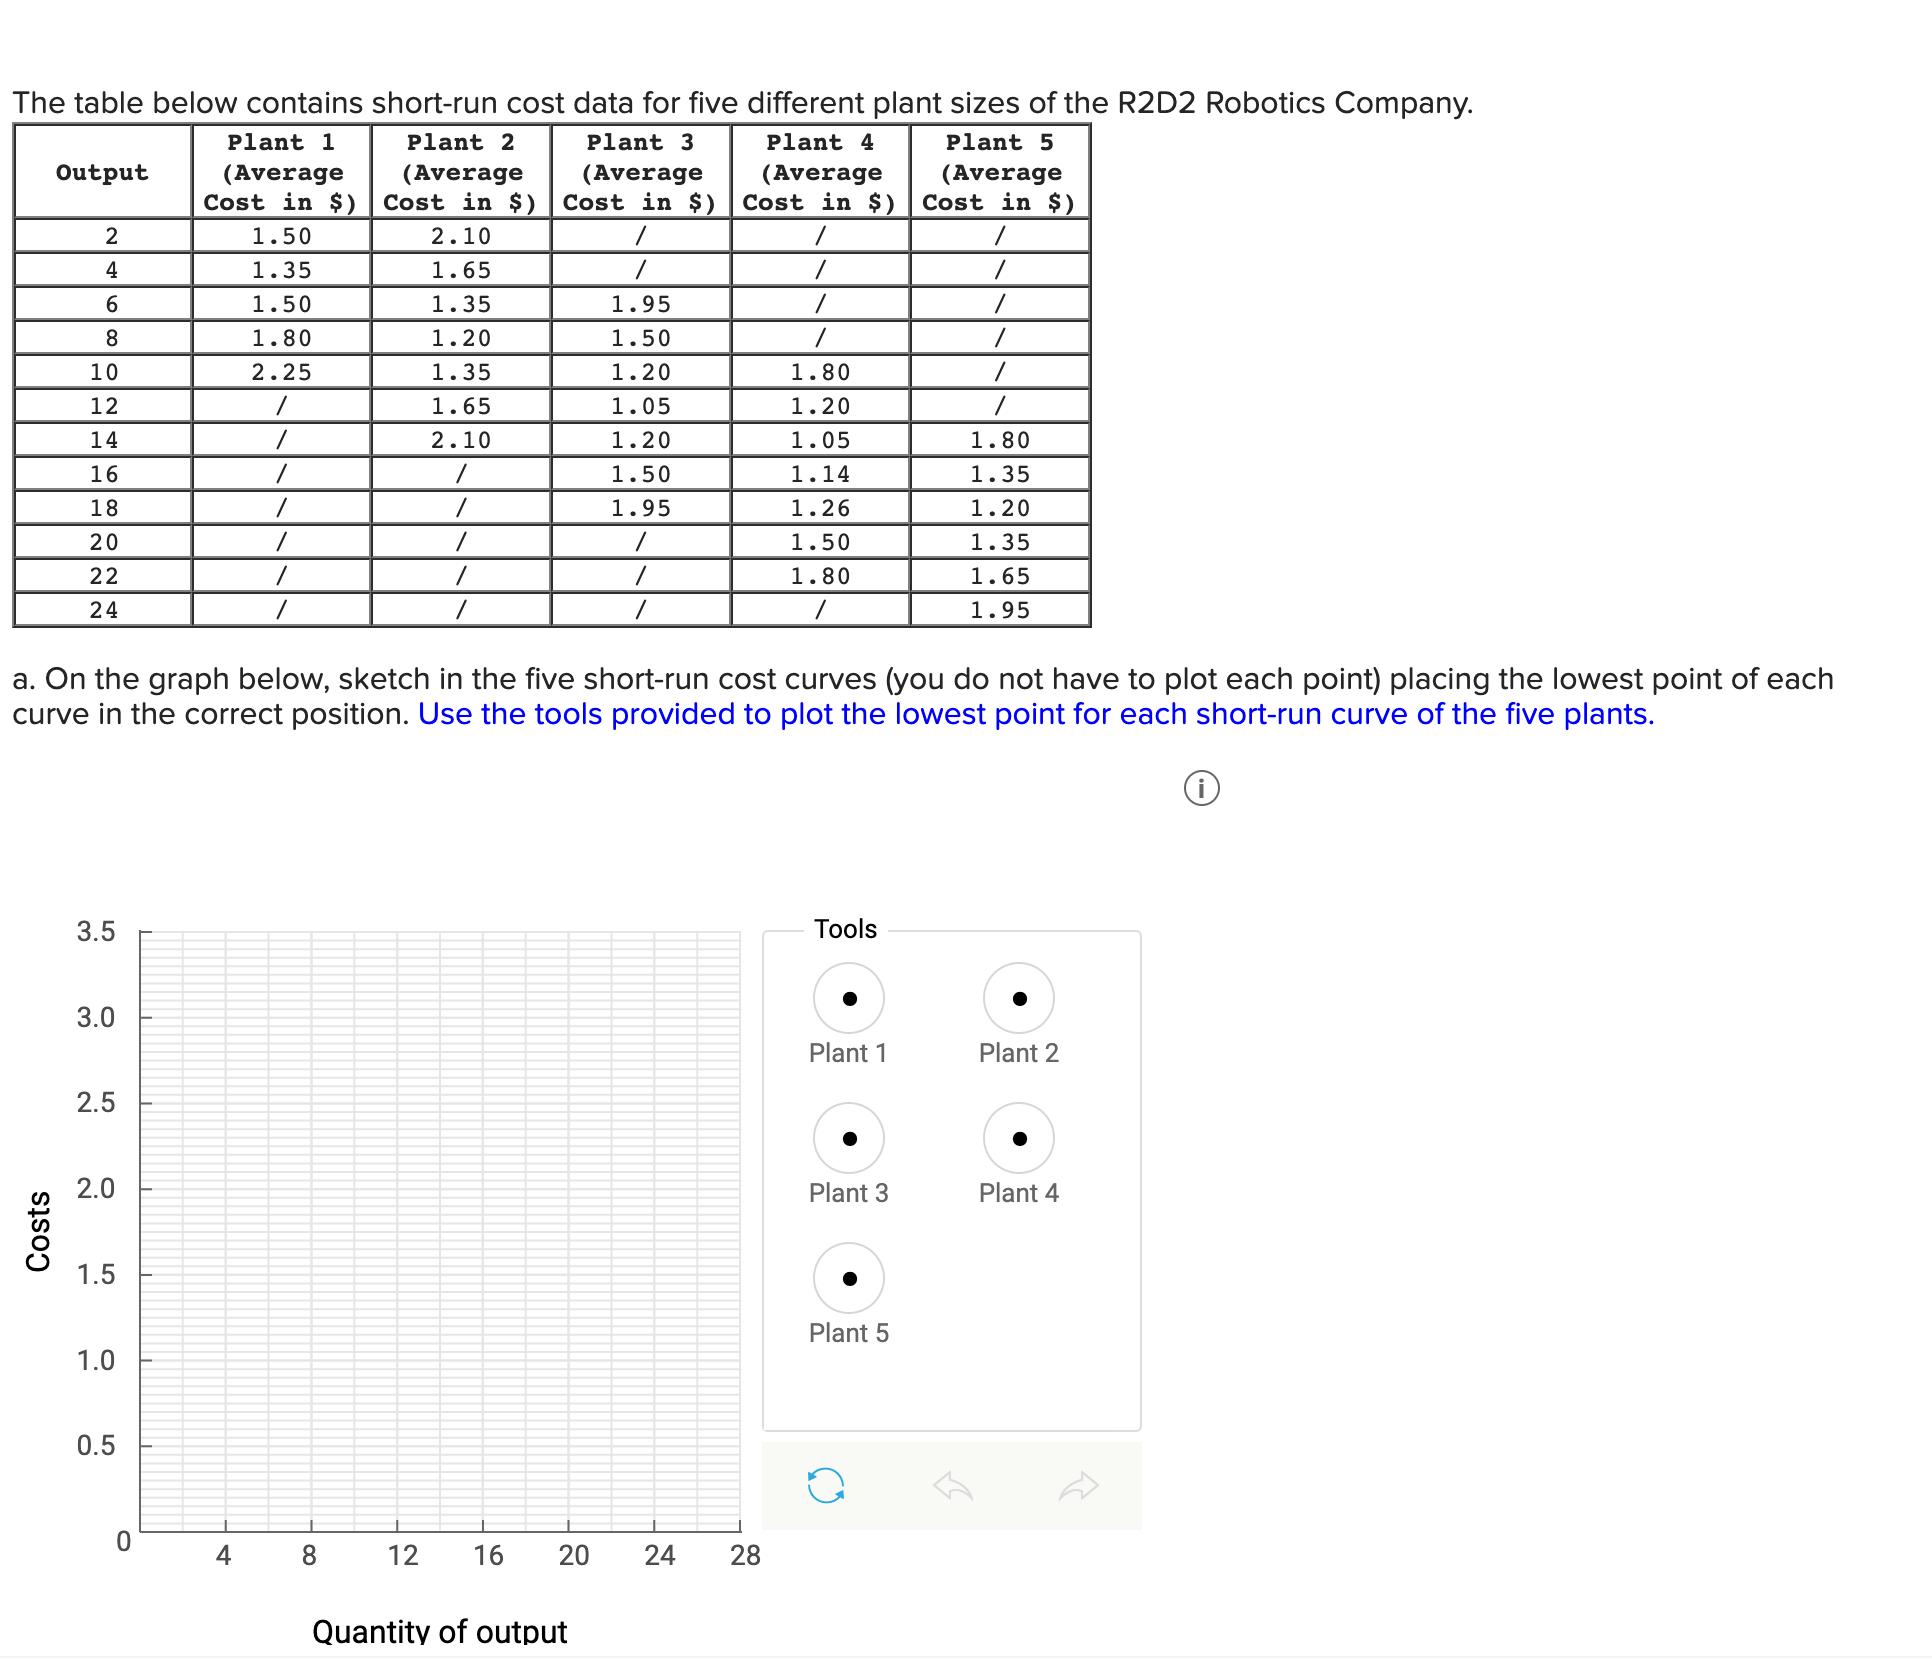
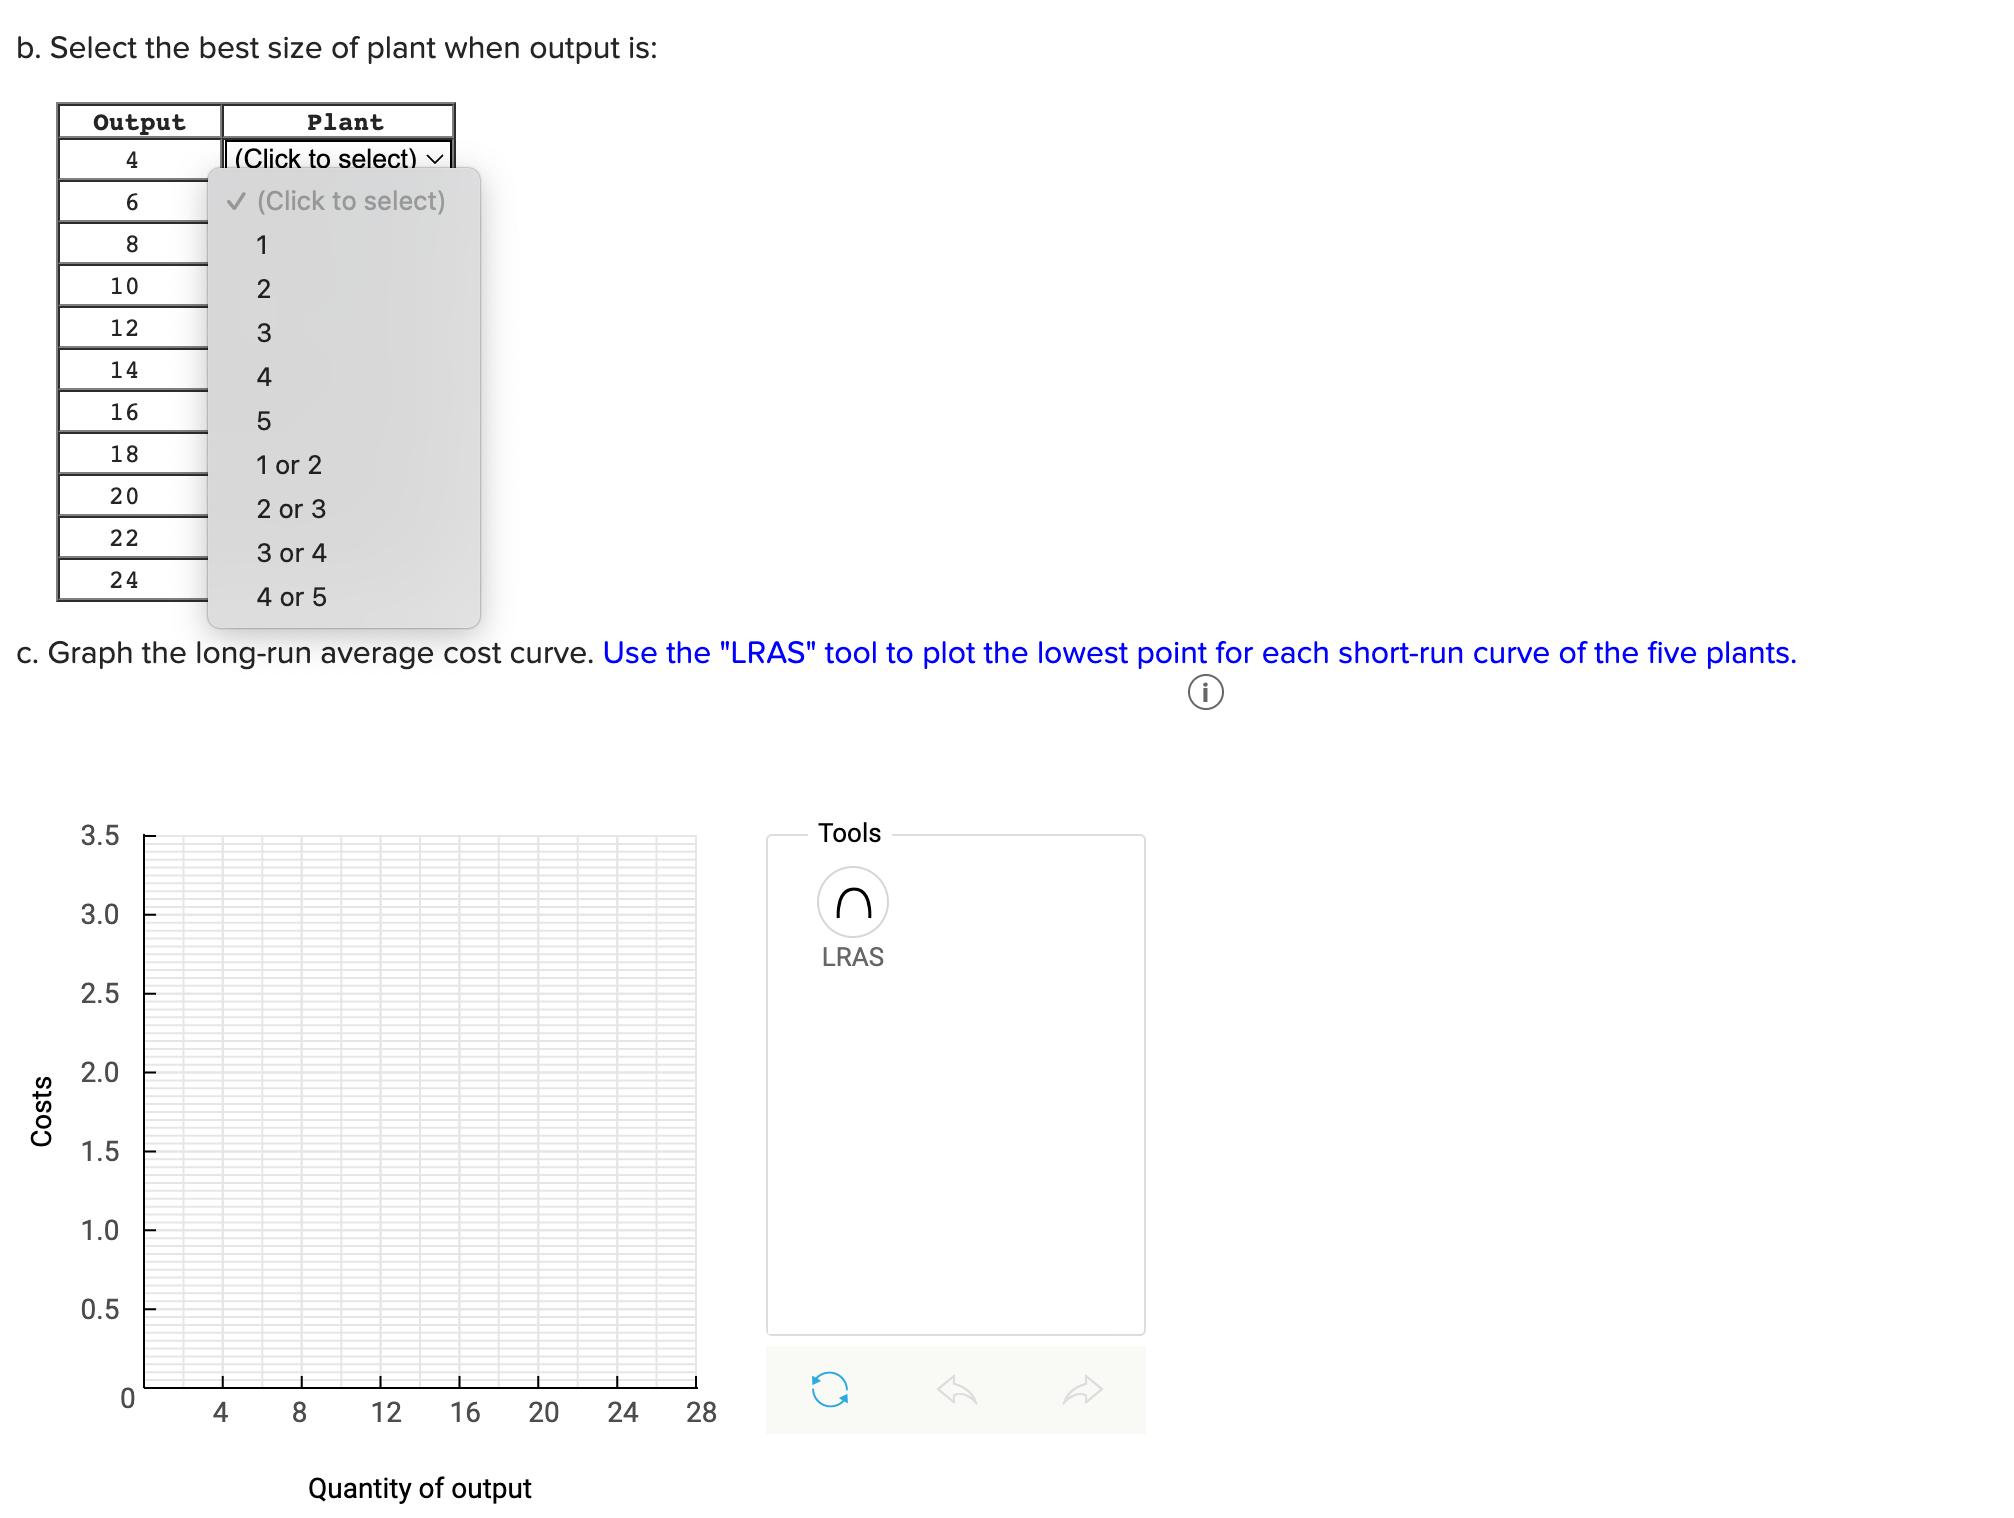
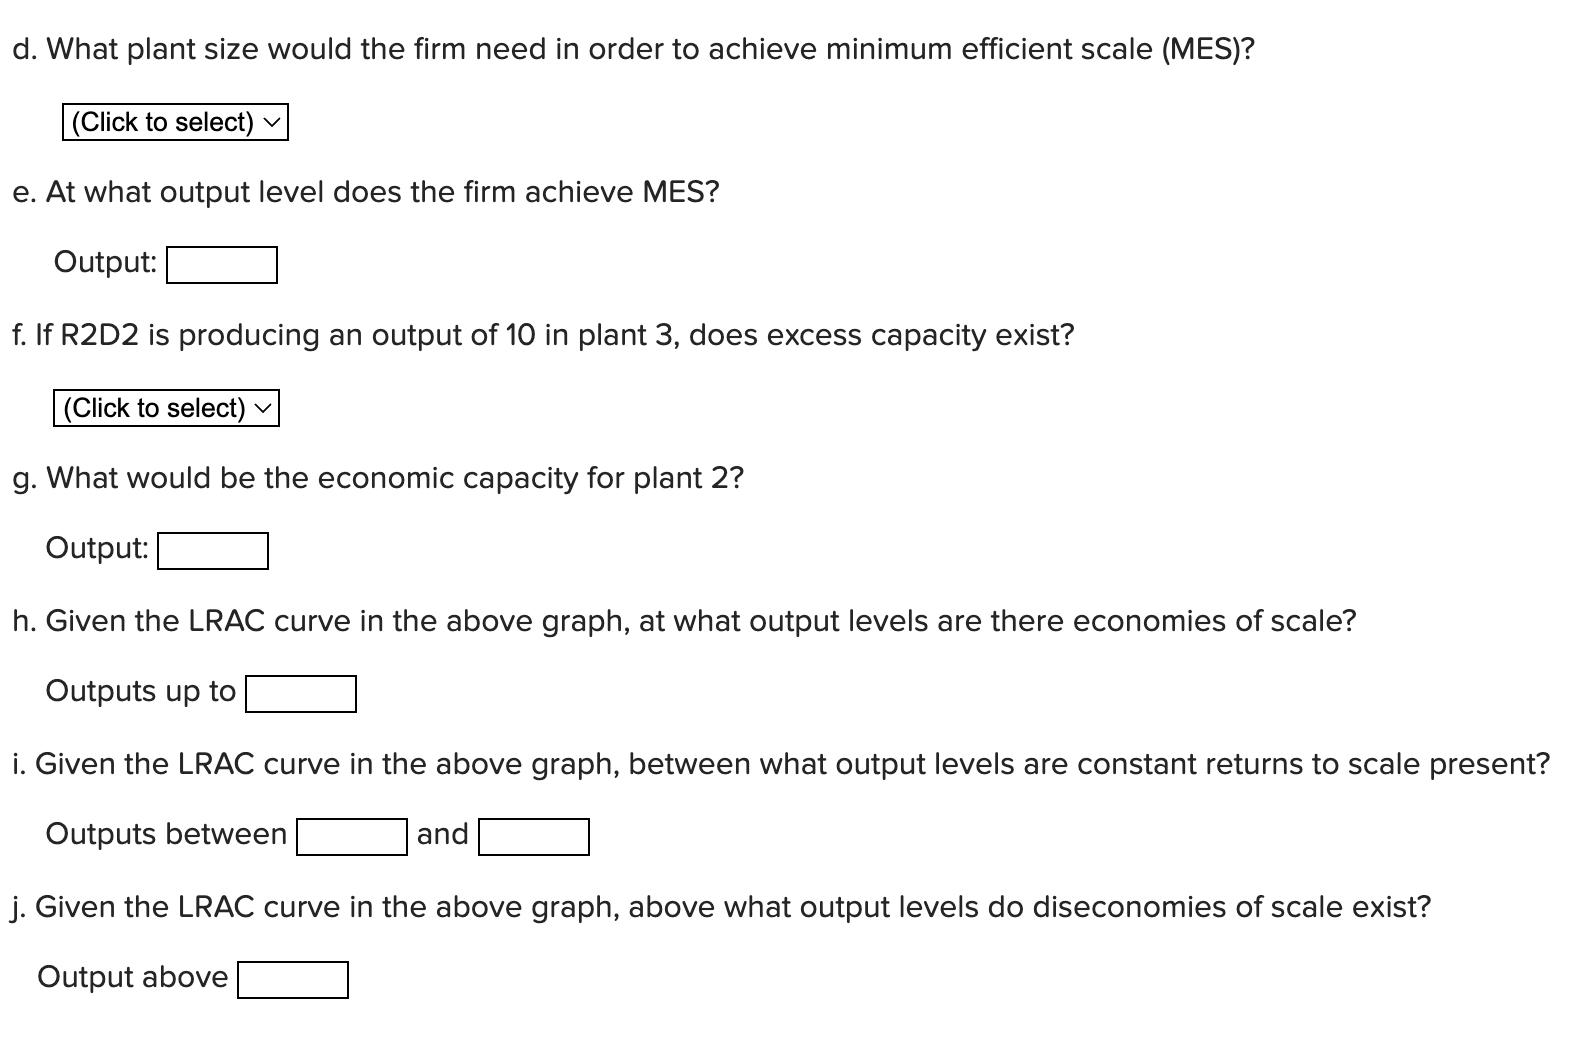
The table below contains short-run cost data for five different plant sizes of the R2D2 Robotics Company. Plant 1 Plant 2 Plant 3 Plant 4 Plant 5 (Average Cost in $) 1.50 (Average (Average Cost in $) Cost in $) 2.10 1.65 1.35 1.20 1.35 1.65 2.10 1 1 Output Costs 2 4 6 8 10 12 14 16 18 20 22 24 3.5 3.0 2.5 2.0 1.5 a. On the graph below, sketch in the five short-run cost curves (you do not have to plot each point) placing the lowest point of each curve in the correct position. Use the tools provided to plot the lowest point for each short-run curve of the five plants. i 1.0 0.5 0 1.35 1.50 1.80 2.25 4 / 8 12 16 20 / 1.95 1.50 1.20 1.05 1.20 1.50 1.95 Quantity of output (Average Cost in $) 1.80 1.20 1.05 1.14 1.26 1.50 1.80 24 28 Tools Plant 1 Plant 3 (Average Cost in $) Plant 5 1.80 1.35 1.20 1.35 1.65 1.95 Plant 2 Plant 4 b. Select the best size of plant when output is: Output 4 6 8 10 12 14 16 18 20 22 24 Costs 3.5 c. Graph the long-run average cost curve. Use the "LRAS" tool to plot the lowest point for each short-run curve of the five plants. 3.0 2.5 2.0 1.5 1.0 0.5 Plant (Click to select) 0 (Click to select) 1 2 3 4 5 1 or 2 2 or 3 3 or 4 4 or 5 4 8 12 16 20 Quantity of output 24 28 Tools n LRAS S d. What plant size would the firm need in order to achieve minimum efficient scale (MES)? (Click to select) v e. At what output level does the firm achieve MES? Output: f. If R2D2 is producing an output of 10 in plant 3, does excess capacity exist? (Click to select) g. What would be the economic capacity for plant 2? Output: h. Given the LRAC curve in the above graph, at what output levels are there economies of scale? Outputs up to i. Given the LRAC curve in the above graph, between what output levels are constant returns to scale present? Outputs between and j. Given the LRAC curve in the above graph, above what output levels do diseconomies of scale exist? Output above
Step by Step Solution
3.44 Rating (167 Votes )
There are 3 Steps involved in it

Get step-by-step solutions from verified subject matter experts