

Question: The table below depicts the activity for a cake bakery for each of the 12 months of a given year. Month January February March
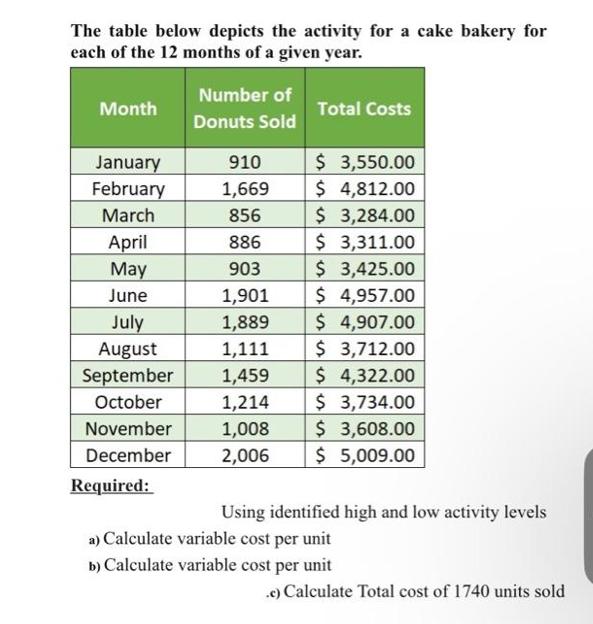
The table below depicts the activity for a cake bakery for each of the 12 months of a given year. Month January February March April May June July August September October November December Required: Number of Donuts Sold Total Costs 910 $ 3,550.00 1,669 $ 4,812.00 856 $ 3,284.00 886 $3,311.00 903 $ 3,425.00 1,901 $ 4,957.00 1,889 $ 4,907.00 1,111 $ 3,712.00 1,459 $ 4,322.00 1,214 $ 3,734.00 1,008 $ 3,608.00 2,006 $ 5,009.00 Using identified high and low activity levels a) Calculate variable cost per unit b) Calculate variable cost per unit c) Calculate Total cost of 1740 units sold
Step by Step Solution
There are 3 Steps involved in it
a To calculate Rumolts pretax WACC we need to weight the cost of equity and the cost of debt by thei... View full answer

Get step-by-step solutions from verified subject matter experts