

Question: The table below, depicts the expected returns and standard deviation of two stocks: Stock Exp. return A 15% B 25% 21% 11% Let y
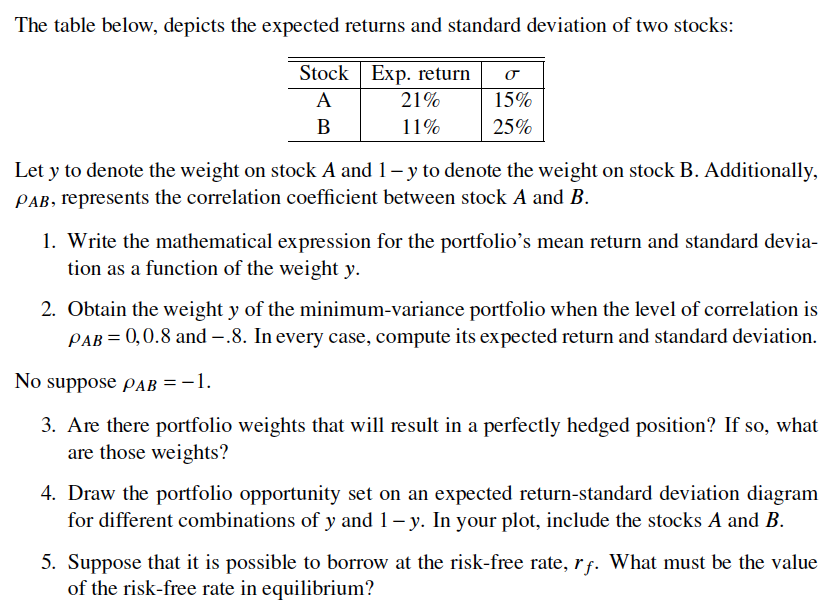
The table below, depicts the expected returns and standard deviation of two stocks: Stock Exp. return A 15% B 25% 21% 11% Let y to denote the weight on stock A and 1-y to denote the weight on stock B. Additionally, PAB, represents the correlation coefficient between stock A and B. 1. Write the mathematical expression for the portfolio's mean return and standard devia- tion as a function of the weight y. 2. Obtain the weight y of the minimum-variance portfolio when the level of correlation is PAB = 0,0.8 and -.8. In every case, compute its expected return and standard deviation. No suppose PAB = -1. 3. Are there portfolio weights that will result in a perfectly hedged position? If so, what are those weights? 4. Draw the portfolio opportunity set on an expected return-standard deviation diagram for different combinations of y and 1-y. In your plot, include the stocks A and B. 5. Suppose that it is possible to borrow at the risk-free rate, r. What must be the value of the risk-free rate in equilibrium?
Step by Step Solution
3.38 Rating (160 Votes )
There are 3 Steps involved in it
To address these questions well use the following notations Expected return of Stock A ERA 21 Expected return of Stock B ERB 11 Standard deviation of ... View full answer

Get step-by-step solutions from verified subject matter experts