

Question: Consider Table 1 , which presents expected returns and standard deviations for two stocks, stock 1 , and stock 2 , and for the riskless
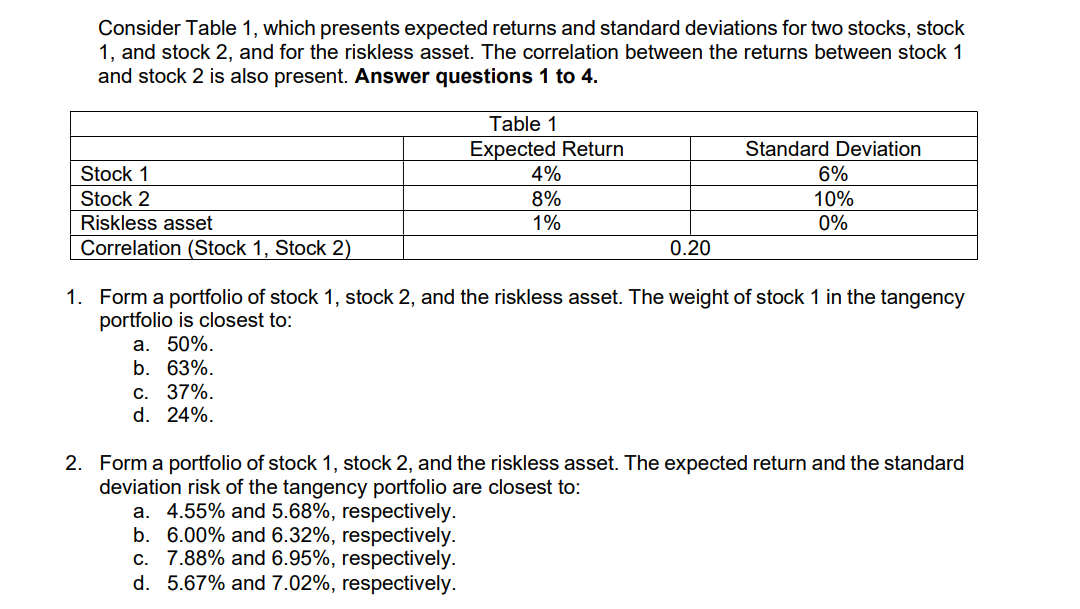
Consider Table which presents expected returns and standard deviations for two stocks, stock
and stock and for the riskless asset. The correlation between the returns between stock
and stock is also present. Answer questions to
Form a portfolio of stock stock and the riskless asset. The weight of stock in the tangency
portfolio is closest to:
a
b
c
d
Form a portfolio of stock stock and the riskless asset. The expected return and the standard
deviation risk of the tangency portfolio are closest to:
a and respectively.
b and respectively.
c and respectively.
d and respectively.
Step by Step Solution
There are 3 Steps involved in it
1 Expert Approved Answer
Step: 1 Unlock

Question Has Been Solved by an Expert!
Get step-by-step solutions from verified subject matter experts
Step: 2 Unlock
Step: 3 Unlock