

Question: The table below displays data on race (W=white, n=non-white), class (U=upper class, M=middle class, W= working class), and perceived discrimination (Y=yes, N=no). Given the variables
The table below displays data on race (W=white, n=non-white), class (U=upper class, M=middle class, W= working class), and perceived discrimination (Y=yes, N=no).
Given the variables in this table, what is the dependent variable?
2 Construct a raw frequency table for race and class
3 Which is the mode for class?
4 What is the frequency for the mode for class?
5 Which is the mode for race?
6 What is the frequency for the mode for race?
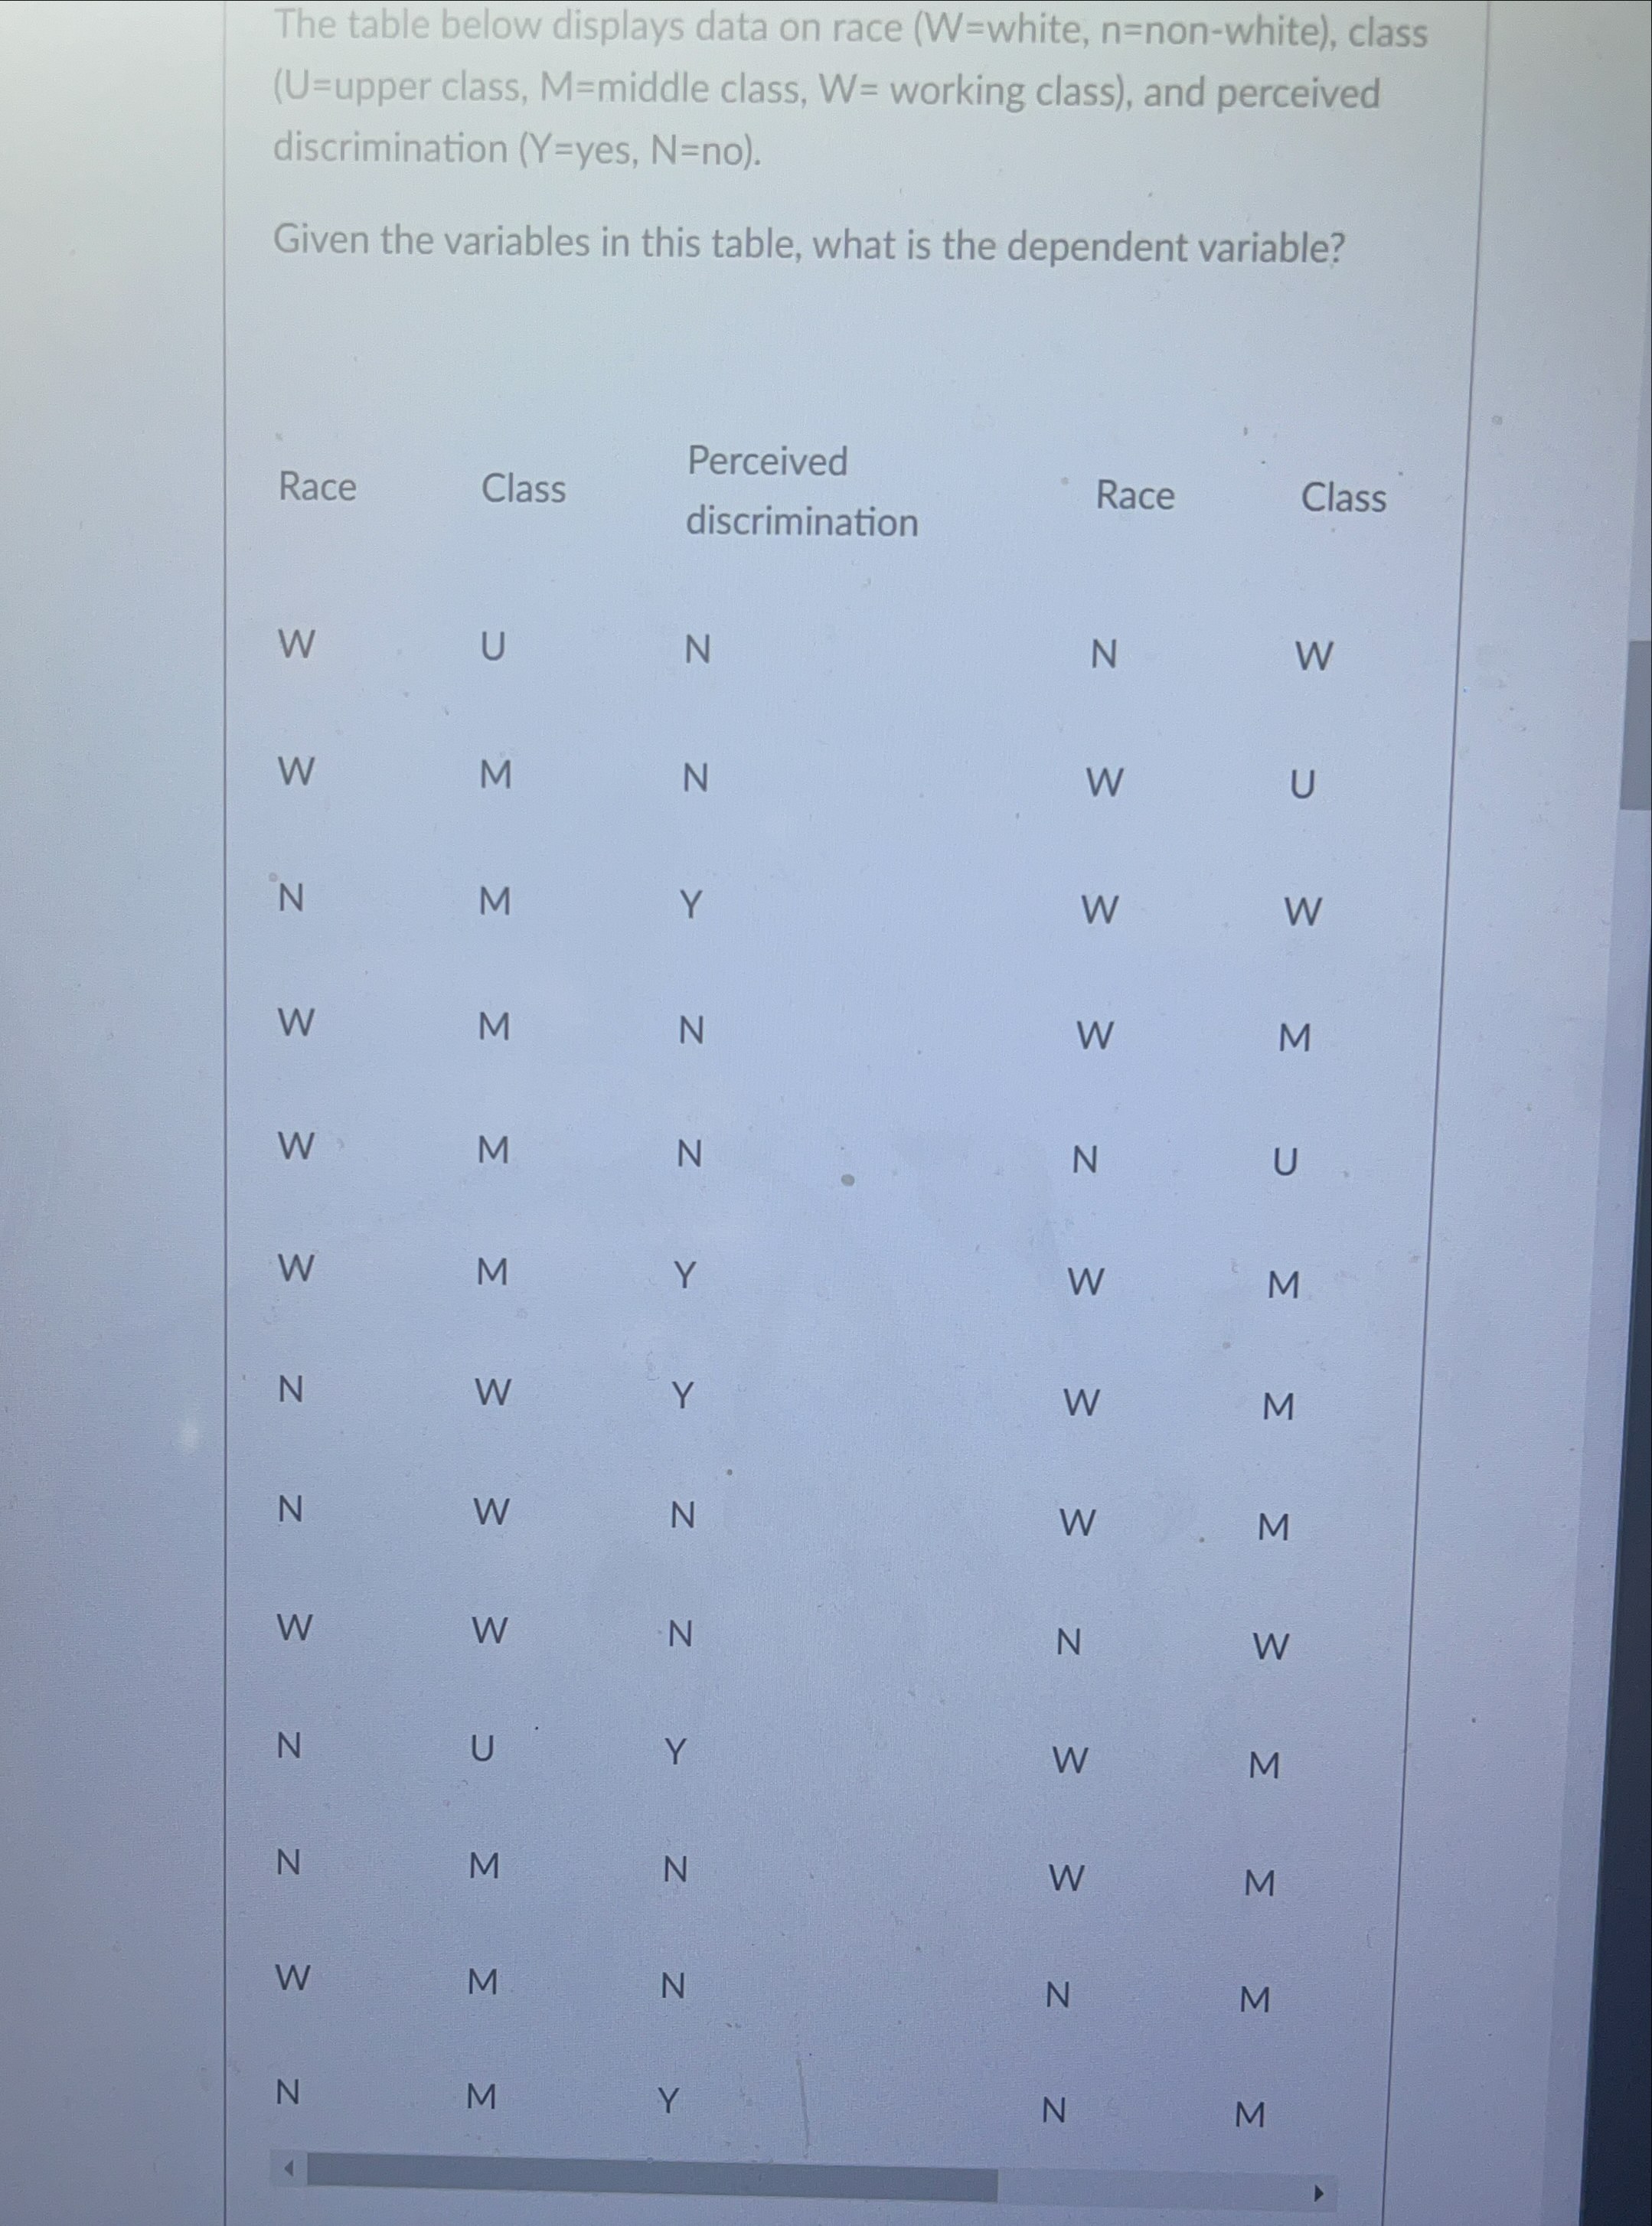
The table below displays data on race (W=white, n=non-white), class (U=upper class, M=middle class, W= working class), and perceived discrimination (Y=yes, N=no). Given the variables in this table, what is the dependent variable? Race Class Perceived discrimination Race Class W U N N W W M N W U N M Y W W W M N W M W M N N U W M Y W M N W Y W M N W N W M W W N N W IN U Y W M N M N W M W M N N M N M Y N M
Step by Step Solution
There are 3 Steps involved in it

Get step-by-step solutions from verified subject matter experts